
Описание
VoltyBands — это адаптивный индикатор на основе волатильности, который динамически отслеживает поведение цены и визуализирует рыночные условия с помощью отзывчивых верхних и нижних полос. В отличие от статичных индикаторов каналов, VoltyBands настраивается в реальном времени, отражая изменения волатильности, помогая трейдерам лучше понимать фазы расширения и сжатия цены.
Объединяя адаптивные расчёты полос с опциональной сглаженной сигнальной линией, VoltyBands предоставляет чёткую структуру для анализа импульса, выявления потенциальных зон разворота и обнаружения периодов консолидации.
Ключевые особенности
- Адаптивные полосы волатильности
Полосы автоматически расширяются и сужаются в зависимости от текущей рыночной активности. - Режим с нулевой центровкой
Возможность отображения движения цены относительно центральной базовой линии для улучшения наглядности. - Опция нормализации
Обеспечивает единообразное масштабирование, упрощая сравнение сигналов между разными инструментами и таймфреймами. - Интегрированное скользящее среднее
Встроенное сглаживание с выбором метода (SMA, EMA, SMMA, LWMA). - Настраиваемое отображение
Опциональная средняя линия и гибкие настройки визуализации.
Как использовать
- Обнаружение импульса
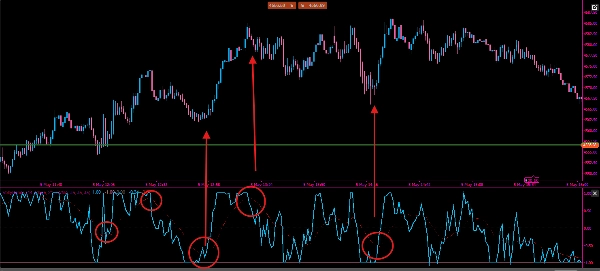
Движение цены близко к верхней полосе может указывать на бычью силу, тогда как близость к нижней полосе свидетельствует о медвежьем давлении. - Зоны разворота
Экстремальные отклонения от центральной линии могут выделять области, где цена может развернуться. - Анализ волатильности
Расширение полос указывает на рост волатильности; сужение — на консолидацию. - Подтверждение сигнала
Используйте скользящее среднее как дополнительный фильтр для входов или выходов.
Параметры
- Длина – Определяет чувствительность расчёта волатильности
- Источник – Входная цена (Close, Open и др.)
- Период MA – Период для линии сглаживания
- Метод MA – Тип скользящего среднего (SMA, EMA, SMMA, LWMA)
- Показать середину – Переключение центральной линии
- Привязка к нулю – Включение визуализации с нулевой базой
- Нормализация – Активация нормализованного масштабирования
Практическое применение
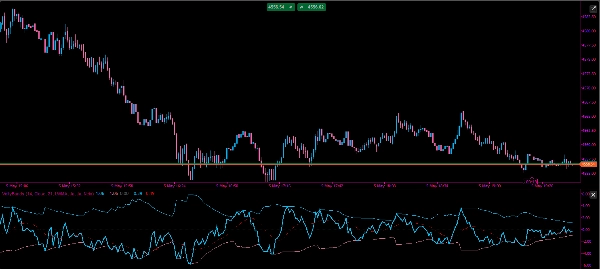
VoltyBands можно использовать для оценки как импульса, так и структуры рынка в реальном времени. Когда цена остаётся близко к верхней полосе, это указывает на устойчивое бычье давление, тогда как постоянное взаимодействие с нижней полосой свидетельствует о медвежьих условиях.
На рынках с боковым движением трейдеры могут ожидать, что цена будет перемещаться между полосами, используя внешние уровни как потенциальные зоны для возврата к среднему. В отличие от этого, во время сильных трендов цена может «ехать» по одной стороне полосы, сигнализируя о продолжении, а не развороте.
Средняя линия может служить динамическим уровнем равновесия. Пересечения выше или ниже этой линии могут использоваться как направляющие сигналы, особенно в сочетании с встроенным скользящим средним для подтверждения.
В нормализованном режиме значения можно интерпретировать как относительные экстремумы, что облегчает выявление чрезмерных состояний независимо от инструмента или таймфрейма.
Как и любой индикатор, VoltyBands наиболее эффективен при использовании вместе с анализом ценового действия и дополнительными инструментами подтверждения.


![Логотип продукта "[Hamster-Coder] Moving Average"](https://cdn.ctrader.com/image/webp/1bd952ad-57d2-4db2-9b49-b01be0b048b8_30113)


