
Description
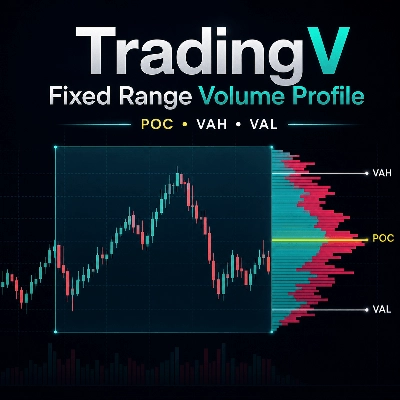
TradingV Fixed Range Volume Profile is a professional volume profile tool designed to help traders analyze where trading activity is concentrated inside a selected price range.
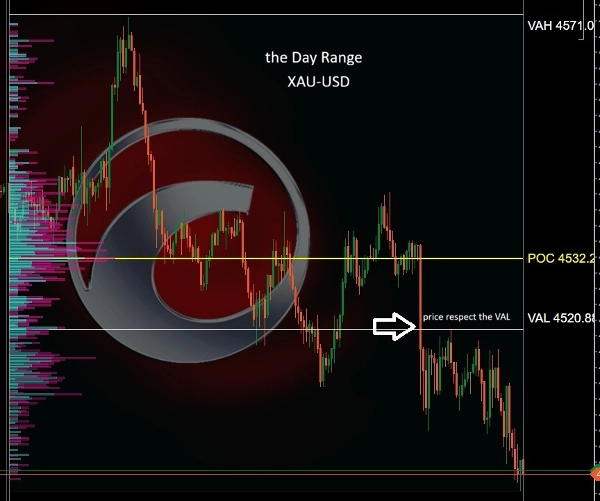
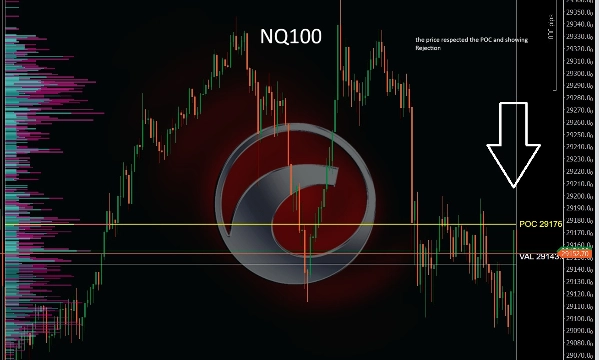
The indicator displays the volume distribution of the chosen range and highlights the most important market structure levels: POC, VAH, and VAL. These levels help traders identify high-liquidity zones, fair value areas, potential support and resistance, and important reaction zones for entries, exits, and trade management.
Volume Profile is widely used by professional traders, and many successful trading strategies are built around understanding where volume has accumulated, where price is accepted, and where price may reject. The POC can act as a major reference point for market balance, while VAH and VAL help define the upper and lower boundaries of the value area.
How to use the inputs:
Range Mode:
Choose how the profile range is selected.
- SessionToday: automatically starts from the defined session start time and continues to the latest available candle.
- ManualTime: allows you to manually set the exact Start Time and End Time for the profile.
- VisibleRange: calculates the profile based on the currently visible chart range.
Session Start Hour / Session Start Minute:
Used with SessionToday mode to define the start of the trading session. For example, if your market session starts at 01:05, set the hour to 1 and the minute to 5.
Start Time / End Time:
Used with ManualTime mode to define a custom fixed range. If End Time is left empty, the indicator uses the latest available candle.
Color Settings:
Customize the up-volume color, down-volume color, POC color, VAH/VAL color, range box opacity, profile opacity, and value area opacity to match your chart style.
Typical use cases:
- Finding key liquidity zones inside a session
- Identifying value area boundaries
- Planning entries near POC, VAH, or VAL
- Managing exits around important volume levels
- Comparing current price location against accepted value
- Supporting price action, intraday, scalping, and swing trading decisions
This indicator is suitable for traders who use volume profile, market structure, auction market theory, support and resistance, or liquidity-based trading methods. It is designed to give a clean visual view of where the market has traded the most volume inside a fixed range.
Note:
TradingV Fixed Range Volume Profile is an analytical tool and does not provide buy or sell signals by itself. It should be used together with your own trading plan, risk management, and market confirmation.
Summary
The indicator offers flexible range selection modes:
- SessionToday, which automatically sets the range from a defined session start time to the latest candle;
- ManualTime, allowing custom start and end times;
- VisibleRange, which uses the currently visible chart area.
Users can customize colors for up-volume, down-volume, POC, VAH/VAL, and adjust opacity settings to fit their chart style. Typical applications include locating key liquidity zones, defining value area boundaries, and supporting various trading styles such as intraday, scalping, and swing trading.
TradingV Fixed Range Volume Profile is designed for traders employing volume profile, market structure, auction market theory, or liquidity-based methods. It provides a clear visual representation of volume concentration but does not generate buy or sell signals independently.






!["[Stellar Strategies] Market Session Ultimate" logo](https://cdn.ctrader.com/image/webp/61ffd537-0125-4246-9e72-42eca1791d64_28232)









