present
Regístrese y obtenga 50 $ de descuento en su primera compra
Trading product for Sync Lines Indicador Key Levels Support & Resistance, image 1
Sync Lines
Indicador
Versión 1.0, May 2026
Windows, Mac
Trading product for Sync Lines Indicador Key Levels Support & Resistance, image 2
Trading product for Sync Lines Indicador Key Levels Support & Resistance, image 3
Desde 06/04/2026

Descripción

Professional Multi-Chart Level Synchronization Tool for cTrader

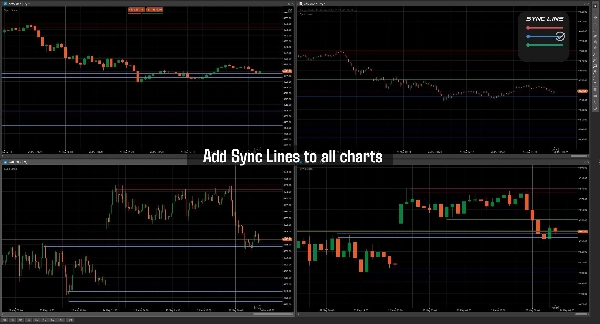
Sync Horizontal Lines is a professional charting utility built for traders who rely heavily on support/resistance zones, liquidity areas, market structure, and multi-timeframe analysis inside cTrader. The indicator allows traders to draw horizontal price levels once and automatically synchronize them across all charts of the same symbol instantly.

Unlike traditional manual chart marking, Sync Horizontal Lines removes repetitive work by keeping levels aligned between different timeframes and chart layouts. Whether you are analyzing M1, M15, H1, or Daily charts, your important levels remain fully synchronized and visually consistent.

The indicator includes a fast hotkey-based workflow for creating, deleting, and color-cycling lines directly from the chart without opening settings panels or menus. Traders can organize support, resistance, liquidity zones, entries, stop losses, take profits, session highs/lows, or custom execution levels using multiple line colors.

A built-in persistent storage system automatically saves all lines locally, ensuring that your levels remain available even after restarting cTrader. Each symbol maintains its own independent synchronized levels, preventing chart clutter between instruments.

Designed for speed and efficiency, Sync Horizontal Lines is lightweight, responsive, and suitable for scalpers, day traders, swing traders, ICT traders, SMC traders, prop firm traders, and multi-monitor trading setups.

Main Features

  • Real-time synchronized horizontal levels across charts
  • Same-symbol multi-timeframe synchronization
  • Automatic local save/load persistence
  • Fast keyboard + mouse workflow
  • Multiple line color management
  • Lightweight and low resource usage
  • Instant level updating across charts
  • No manual re-drawing required
  • Professional workflow optimization


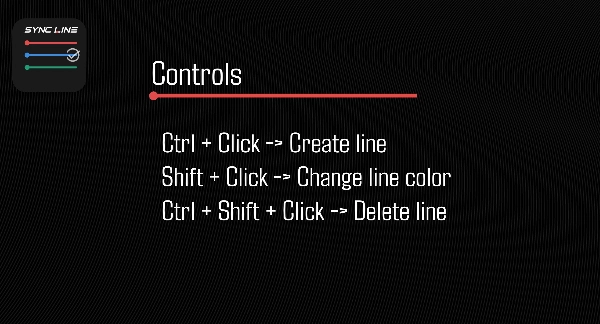
Controls

  • Ctrl + Click → Create line
  • Shift + Click → Change line color
  • Ctrl + Shift + Click → Delete line


Ideal For

  • Support & Resistance traders
  • ICT and SMC strategies
  • Scalping workflows
  • Intraday trading
  • Liquidity mapping
  • Session range marking
  • Multi-monitor setups
  • Professional chart management


Installation

Simply add the indicator to your Multicharts of different timeframe and start drawing using the keyboard shortcuts. No setup required.

The Indicator must be added to different charts to work properly.

Resumen

Perfil del indicador
Categoría del indicador
Soporte y resistencia
Tipo de resultado
Visualización
Requisitos de datos
Únicamente barras

Conversación

Valoraciones de clientes

0.0
Valoraciones: 0
Valoraciones de clientes
Este producto todavía no se ha valorado. ¿Ya lo ha probado? Sea el primero en informar a otros.

Preguntas frecuentes

Key Levels
Support & Resistance
Los productos disponibles a través de cTrader Store, incluidos bots, indicadores y plugins para operar, son proporcionados por desarrolladores de terceros y están disponibles únicamente con fines informativos y de acceso técnico. cTrader Store no es un bróker, por lo que no proporciona asesoramiento de inversión, recomendaciones personales ni ninguna garantía de rentabilidad futura.

Puede interesarle

Indicador
cTreder Smart SMA
Indicador
Volume
Key Levels
+1
Session volume profiles from tick volume: POC, value area high and low, and naked POCs extended until touched.
Indicador
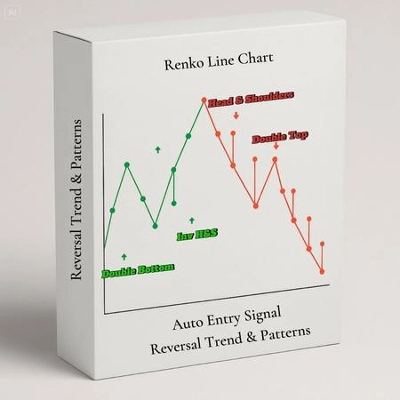
Smart Signal Reversal Trend + Patterns
Indicador
RSI
VWAP
+5
Trend direction, chart signals, reversal zones and volume tools in one configurable indicator.
Indicador
ATR
MACD
+15
MACD Advanced -- It combines the standard MACD logic with a rich set of visual tools
Indicador
AI
ATR
+27
Market Cipher B
Indicador
EMA
RSI
+5
MACD Colour Histogram with 11 Moving Average Types, Multi-timeframe confirmation and Sound Signal Alert.
Indicador
Drawdown Monitor
Proprietary trading desk risk monitoring dashboard!
Indicador
ATR
Wedge
+2
Strong Supertrend Turn Market Movement into a Clear Map Market analysis
Indicador
Volume
Support & Resistance
Compare up to 27 symbols across eight timeframes with seven analysis engines and an interactive cTrader dashboard.
Indicador
Signal
Trades Opening Range Breakouts Indicator with dynamic stops/targets adapting to market volatility.
Indicador
RSI
MACD
+5
LudwigICT – Digital Root & IDR (cTrader Automate)
Indicador
Prop
Forex
+4
HMA MTF 2.0 (Multi-Timeframe )
Indicador
Forex
BTCUSD
+9
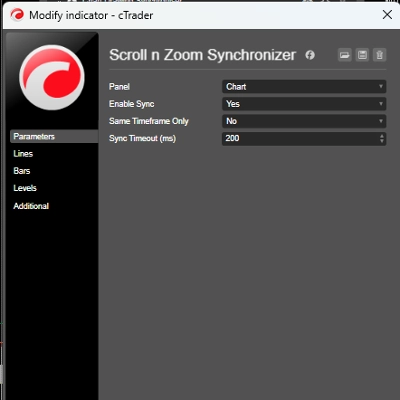
synchronize scroll position and zoom levels across multiple charts. Perfect for multi-timeframe analysis
Indicador
SMC
Signal
+2
Gold Market Maker Zones; Non-repainting Supply & Demand detector for XAUUSD. Precise institutional zones for cTrader.
Indicador
Prop
Forex
+11
🌊 See when the market is truly in play. Tsunami measures Relative Volume by time-of-day 🌊
Indicador
VWAP
Forex
+12
Unlock VWAP in cTrader! Choose anchor periods, price sources, and display deviation bands with real-time tick updates.
Indicador
Forex
BTCUSD
+5
Trend analysis, automatic analysis, position, swingtrader, scalper

Precio

Desde 06/04/2026