


Açıklama
Sabit Hacim Profili, geriye dönük pencerenizi sabit sayıda fiyat seviyesine böler ve her birinde ne kadar hacim işlem gördüğünü, alım ve satım baskısına göre ayırarak gösterir.
NE ÇİZER
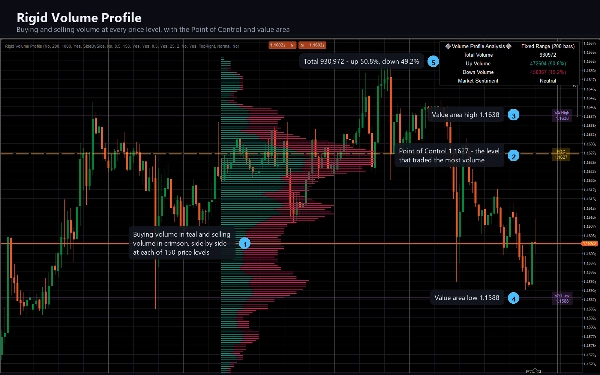
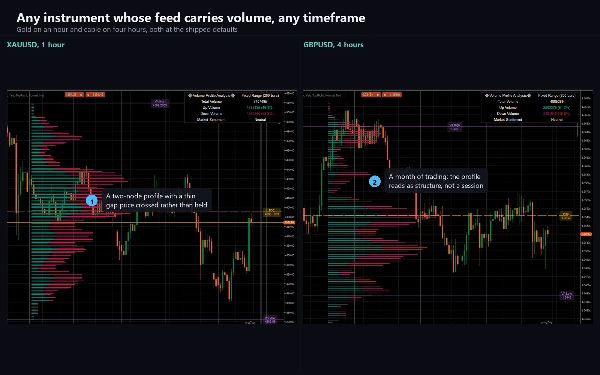
Fiyat hareketinin yanında, son N bar’dan oluşturulmuş yatay bir histogram. Her seviyenin çubuğu, yükselişle kapanan barlardan gelen boğa hacmi ve düşüşle kapanan barlardan gelen ayı hacmi olarak ayrılır, böylece sadece işlemin nerede gerçekleştiğini değil hangi tarafın yaptığını da görebilirsiniz. Değişmeyen kapanışlı barlar hacimlerini eşit olarak ikiye böler.
Kesikli Kontrol Noktası çizgisi, pencerede en çok hacmin işlem gördüğü fiyat seviyesini işaretler ve tam fiyatıyla etiketlenir.
İki değer alanı çizgisi, pencerenin hacminin %70’ini oluşturan seviyeleri sınırlar ve her biri etiketlenir.
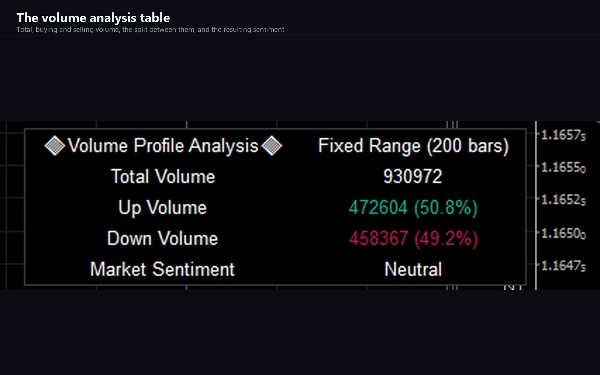
Bir hacim analiz tablosu, toplam, yukarı ve aşağı hacmi yüzdelerle raporlar ve hangi tarafın hakim olduğuna dayalı bir duygu okuması sunar.
NASIL KULLANILIR
Hacim profilleri, fiyatın sadece hareket ettiği yerden ziyade işlemin gerçekten nerede gerçekleştiğini tanımlar. Çok hacim emen bir seviye, birçok katılımcının önem verdiği bir seviyedir; profilin ince bir kısmı ise piyasanın hızlıca geçtiği bir fiyat aralığıdır.
Kontrol Noktasını pencerenin ağırlık merkezi olarak okuyun. Değer alanını ise işlerin çoğunun yapıldığı aralık olarak değerlendirin. İki yoğun düğüm arasındaki ince boşluğu, fiyatın içinde kalmaktan çok geçme eğiliminde olduğu bir bölge olarak okuyun. Fiyat o seviyeye döndüğünde, bölünmenin hangi tarafının hakim olduğunu izleyin.
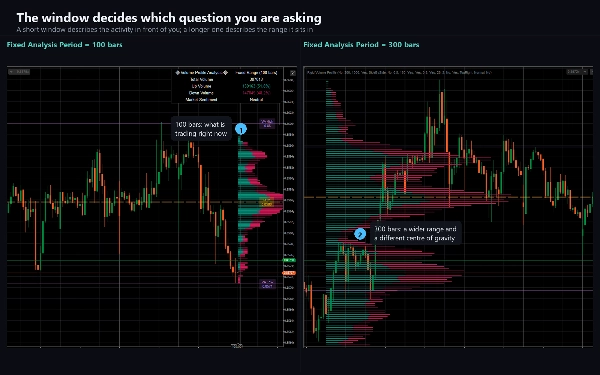
Pencereyi siz seçersiniz ve resim onunla değişir, bu yüzden verdiğiniz karara uygun bir geriye dönük süre seçin. 100 bar profili, 500 bar profilinden farklı bir soruya cevap verir.
ANA AYARLAR
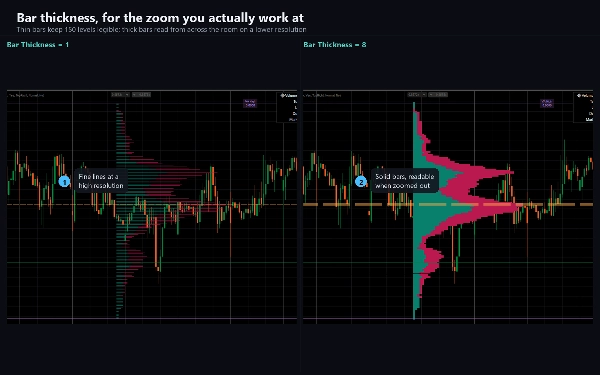
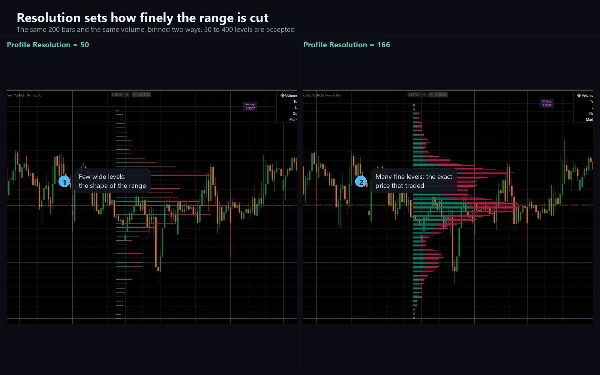
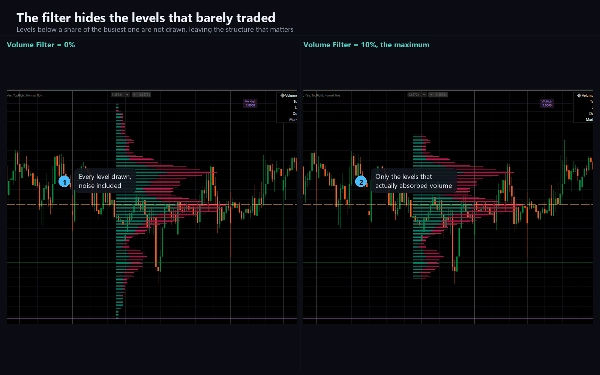
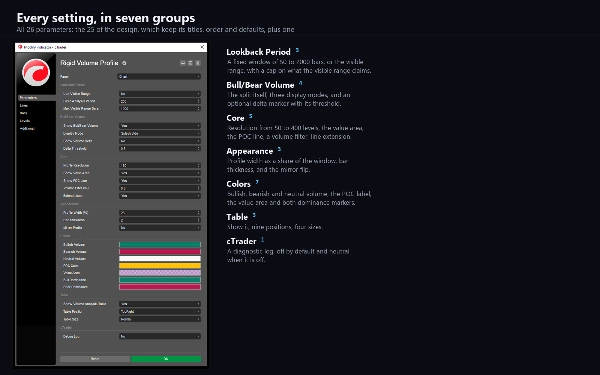
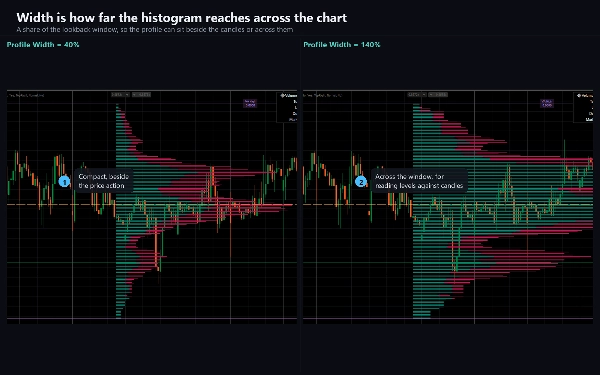
Sabit Analiz Süresi, geriye dönük bar sayısını 50 ile 2000 arasında ayarlar. Profil Çözünürlüğü, aralığın kaç fiyat seviyesine bölüneceğini 50 ile 400 arasında belirler; daha az seviye klasik profil gibi okunur, daha fazla detay verir. Görüntüleme Modu, Yan Yana, Üst Üste ve Bölünmüş seçenekleri sunar. Profil Genişliği, histogramı geriye dönük sürenin yüzdesi olarak ölçeklendirir. Hacim Filtresi, en yoğun seviyenin altındaki seviyeleri gizler. Hacim Delta Göster, bir tarafın açıkça hakim olduğu yerde işaretçi ekler. Her renk ayarlanabilir ve analiz tablosu dokuz konumdan herhangi birine taşınabilir veya kapatılabilir.
Görünür Aralığı Kullan, geriye dönük sayıyı sabit bir sayı yerine ekranda şu anda görünen barlara geçirir.
GÖSTERGE TİPİ VE PENCERE
Grafik üstü. Fiyat grafiğinin kendisine çizilir, ayrı bir pencerede değil.
ZAMAN DİLİMLERİ VE ENSTRÜMANLAR
Her zaman dilimi. En faydalısı gün içi, M5'ten H4'e kadar olan zaman dilimleridir; burada bir seansın hacim dağılımı anlamlı bir nesnedir.
Hacim taşıyan herhangi bir enstrümanda çalışır. Forex'te bu, bar başına fiyat güncellemelerinin sayısı olan tik hacmidir; bu, işlem hacmi yerine aktivitenin bir göstergesidir. Endeks ve emtia CFD'lerinde bazı brokerlar gerçek borsa hacmi sağlar ve profil burada daha anlamlıdır. Hacim olmayan bir enstrümanda ise hiçbir şey çizilmez.
KİMLER İÇİN
Zaten hacim profilleri ile çalışan ve sabit bir ızgaraya ve açık alım-satım ayrımına sahip bir profil isteyen, sabit seans profili yerine.
DENEME
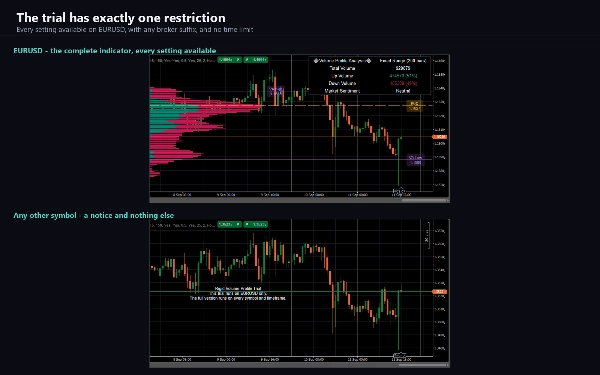
Bu ürüne bir deneme sürümü eklenmiştir. Tüm ayarların mevcut olduğu tam göstergedir, EURUSD ile sınırlıdır. Tam sürüm bu sınırlamayı kaldırır ve başka bir şey eklemez.
TEKNİK NOTLAR VE SINIRLAMALAR
Profil, oluşan barın her tikinde yeniden hesaplanır, bu yüzden Kontrol Noktası ve değer alanı bir bar içinde hareket eder ve kapanınca yerleşir. Bu tasarım gereğidir. Buradaki hiçbir şey kapalı bar sinyali değildir.
Profil Çözünürlüğü 166'nın üzerinde olduğunda en düşük fiyat seviyeleri çizilmez. Bu, tasarımın kasıtlı bir sınırıdır; sabit bir çizim nesnesi havuzu ayırır ve her fiyat seviyesi için üç nesne kullanır; Göster POC Çizgisi ve Göster Değer Alanı geçişleri her biri birini serbest bırakır. Tam profili görmek için Profil Çözünürlüğünü 166 veya altında tutun.
Değer alanı, seviyeleri hacme göre sıralayarak ve %70'e ulaşana kadar sırayla alarak oluşturulur, sonra bunlar arasındaki en yüksek ve en düşük fiyat raporlanır. Bu yüzden genellikle Kontrol Noktasından dışa doğru yürüyerek oluşturulan değer alanından daha geniştir.
Profil brokerınızın hacminden oluşturulduğu için, aynı piyasadan iki broker aynı profili üretmez.
AccessRights None: gösterge sipariş vermez, hiçbir şeyi değiştirmez ve hesap verisi okumaz.
DESTEK
Her parametreyi, insanları şaşırtan ayarları ve sorun giderme rehberini kapsayan dokümantasyon ürünle birlikte gelir. Sorular Tartışma sekmesi üzerinden memnuniyetle karşılanır; faydalı bir rapor sembolü, brokerı, zaman dilimini, cTrader sürümünü ve varsayılandan değiştirilen ayarları belirtir.
Ticaret risk içerir. Geçmiş performans gelecekteki sonuçları garanti etmez.
Özet
Users can customize the lookback period (50 to 2000 bars), profile resolution (50 to 400 levels), display mode (side by side, stacked, split), profile width, and volume filtering. The profile updates dynamically on every tick of the forming bar. It supports any timeframe and instruments with volume data, including tick volume for forex and real exchange volume for some CFDs. The indicator is intended for traders familiar with volume profiles seeking detailed buying and selling pressure insights on a fixed grid rather than session-based profiles. A trial version is available with full features restricted to EURUSD.





























