
คำอธิบาย
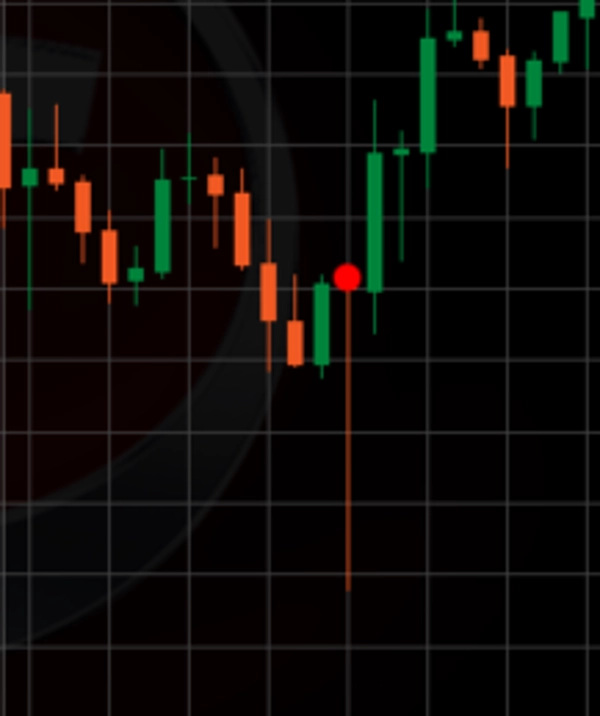
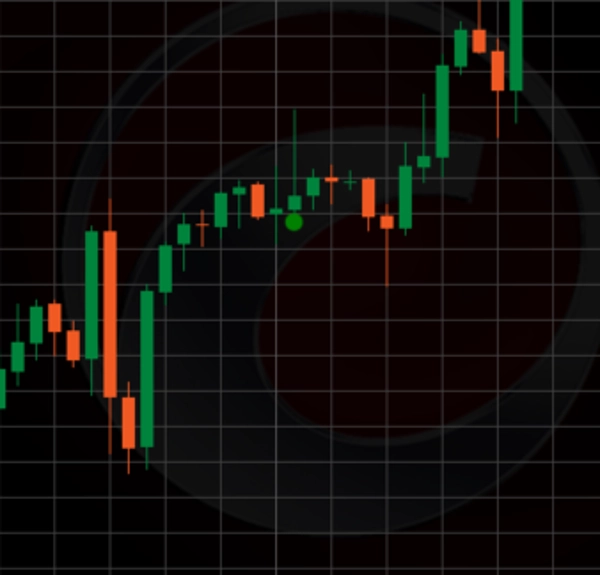
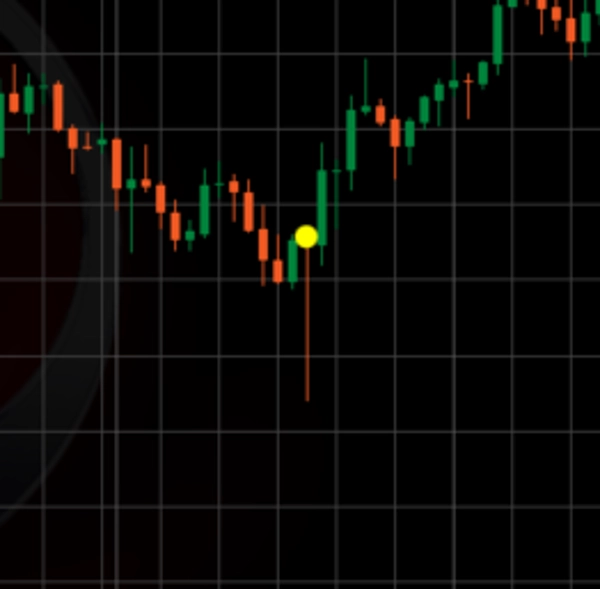
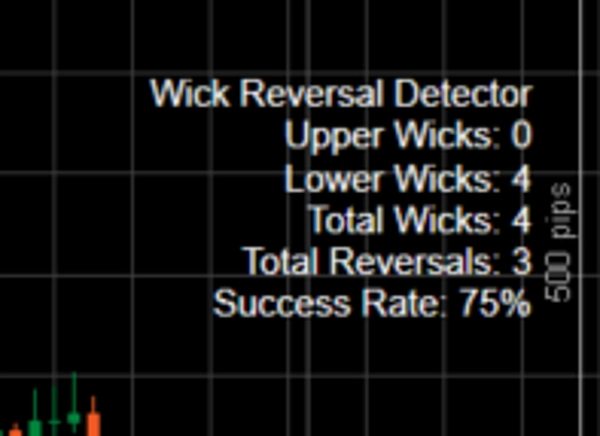
ตัวบ่งชี้ Long Wick เป็นเครื่องมือวิเคราะห์ทางเทคนิคที่ทรงพลังซึ่งสร้างขึ้นสำหรับ cTrader โดยเน้นการระบุแท่งเทียนที่มีไส้เทียนยาวผิดปกติ—ไม่ว่าจะเป็นไส้เทียนบนหรือล่าง—เมื่อเทียบกับขนาดของตัวแท่งเทียนและช่วงแท่งเทียนเฉลี่ย มันเน้นไส้เทียนเหล่านี้บนกราฟเป็นจุดกลับตัวที่เป็นไปได้ ซึ่งตลาดอาจปฏิเสธราคาที่สูงขึ้น (สำหรับไส้เทียนบน ซึ่งบ่งชี้การกลับตัวแบบขาลง) หรือราคาที่ต่ำกว่า (สำหรับไส้เทียนล่าง ซึ่งบ่งชี้การกลับตัวแบบขาขึ้น) ตัวบ่งชี้ใช้การผสมผสานของตัวคูณเกณฑ์ไส้เทียน อัตราส่วนไส้เทียนต่อแท่งขั้นต่ำ และค่าเฉลี่ยเคลื่อนที่แบบง่าย (SMA) ที่กรองแนวโน้มเพื่อกรองเสียงรบกวนและเน้นรูปแบบการปฏิเสธราคาที่สำคัญ ไส้เทียนที่ตรวจพบแต่ละอันจะถูกทำเครื่องหมายด้วยวงกลม (สีเขียวสำหรับไส้เทียนบน สีแดงสำหรับไส้เทียนล่างหากยืนยันว่าเป็นการกลับตัว หรือสีเหลืองหากไม่ใช่) และข้อมูลสถิติ (เช่น ไส้เทียนทั้งหมด การกลับตัว และอัตราความสำเร็จ) จะแสดงบนกราฟเพื่อการติดตามที่ง่ายดาย
วิธีใช้ในการเทรด:
- การระบุโอกาสกลับตัว: ใช้ตัวบ่งชี้เพื่อตรวจจับไส้เทียนยาวที่เกิดขึ้นที่ระดับแนวรับหรือแนวต้านสำคัญ หรือทวนกับแนวโน้มที่มีอยู่ (เช่น ไส้เทียนล่างยาวในแนวโน้มขาลงสำหรับการกลับตัวแบบขาขึ้นที่เป็นไปได้) วงกลมสีเขียวหรือสีแดงที่ชัดเจนแสดงถึงการกลับตัวที่ได้รับการยืนยันตามการเคลื่อนไหวของราคาในช่วงเวลาที่กำหนด ทำให้เป็นสัญญาณที่ควรพิจารณาเข้าทำการซื้อขายในทิศทางตรงกันข้าม (เช่น ซื้อเมื่อเกิดการกลับตัวของไส้เทียนล่างสีแดง ขายเมื่อเกิดการกลับตัวของไส้เทียนบนสีเขียว)
- การยืนยันด้วยเครื่องมืออื่น ๆ: รวมตัวบ่งชี้ Long Wick กับตัวบ่งชี้ทางเทคนิคอื่น ๆ (เช่น RSI, MACD หรือเส้นแนวรับ/แนวต้าน) เพื่อยืนยันสัญญาณกลับตัวและหลีกเลี่ยงสัญญาณเท็จ โดยเฉพาะในตลาดที่ผันผวน
- การจัดการความเสี่ยง: วางคำสั่งหยุดขาดทุนเกินกว่าจุดสูงสุดหรือต่ำสุดของไส้เทียน (เช่น ต่ำกว่าจุดต่ำสุดสำหรับการกลับตัวแบบขาขึ้น) เพื่อป้องกันความเป็นไปได้ที่การกลับตัวจะล้มเหลว และตั้งระดับทำกำไรตามแนวรับ/แนวต้านใกล้เคียงหรืออัตราส่วนความเสี่ยงต่อผลตอบแทน (เช่น 1:2)
- การติดตามอัตราความสำเร็จ: ตรวจสอบอัตราความสำเร็จที่แสดงเป็นประจำเพื่อประเมินประสิทธิภาพของตัวบ่งชี้เมื่อเวลาผ่านไปและปรับกลยุทธ์ของคุณตามนั้น
การปรับพารามิเตอร์เพื่อการใช้งานที่ดีที่สุด:
- ช่วงเวลาย้อนหลัง (ค่าเริ่มต้น: 5): กำหนดจำนวนแท่งเทียนที่ใช้ในการคำนวณช่วงแท่งเทียนเฉลี่ย ช่วงเวลาสั้น (เช่น 3-10) ทำให้ตัวบ่งชี้ตอบสนองต่อความผันผวนล่าสุดได้ดี เหมาะสำหรับตลาดที่เคลื่อนไหวรวดเร็ว ในขณะที่ช่วงเวลายาว (เช่น 20-50) ช่วยให้ค่าเฉลี่ยเรียบขึ้นสำหรับสภาวะตลาดที่มีแนวโน้ม ปรับตามกรอบเวลาของคุณ (เช่น ต่ำกว่าสำหรับกราฟ 1 นาที สูงกว่าสำหรับกราฟ 1 ชั่วโมง)
- ช่วงเวลามองไปข้างหน้า (ค่าเริ่มต้น: 15): กำหนดจำนวนแท่งเทียนที่ใช้ยืนยันการกลับตัว ช่วงเวลาสั้น (เช่น 5-10) เหมาะสำหรับกลยุทธ์สเกลปิ้งอย่างรวดเร็ว ในขณะที่ช่วงเวลายาว (เช่น 15-30) เหมาะสำหรับการเทรดสวิงเพื่อจับการกลับตัวที่ยาวนานขึ้น เพิ่มค่านี้หากคุณสังเกตเห็นเครื่องหมายสีเหลืองจำนวนมากซึ่งการกลับตัวเกิดขึ้นช้ากว่า
- ตัวคูณเกณฑ์ไส้เทียน (ค่าเริ่มต้น: 1.3): คูณช่วงแท่งเทียนเฉลี่ยเพื่อกำหนดความยาวไส้เทียนขั้นต่ำ ค่าต่ำกว่า (เช่น 1.0-1.5) ตรวจจับไส้เทียนได้มากขึ้น (เหมาะสำหรับตลาดที่มีความผันผวนต่ำ) ในขณะที่ค่าที่สูงกว่า (เช่น 2.0-3.0) กรองเฉพาะไส้เทียนที่สำคัญที่สุด (เหมาะสำหรับตลาดที่มีความผันผวนสูง) ปรับค่านี้เพื่อสมดุลระหว่างความไวและคุณภาพของสัญญาณ
- ช่วงแนวโน้ม (SMA) (ค่าเริ่มต้น: 21): กำหนดความยาวของ SMA สำหรับการกรองแนวโน้ม ช่วงเวลาสั้น (เช่น 10-20) ตอบสนองต่อแนวโน้มระยะสั้น ในขณะที่ช่วงเวลายาว (เช่น 50-100) สอดคล้องกับแนวโน้มระยะยาว ปรับให้เหมาะสมกับระยะเวลาการเทรดและสภาวะตลาดของคุณ
- อัตราส่วนไส้เทียนต่อแท่งขั้นต่ำ (ค่าเริ่มต้น: 3): กำหนดอัตราส่วนขั้นต่ำของความยาวไส้เทียนต่อขนาดแท่งเทียน อัตราส่วนต่ำกว่า (เช่น 2-3) รวมแท่งเทียนที่มีไส้เทียนปานกลางมากขึ้น ในขณะที่อัตราส่วนสูงกว่า (เช่น 4-5) เน้นแท่งเทียนที่มีไส้เทียนเด่นชัดมากขึ้น เพิ่มค่านี้เพื่อสัญญาณกลับตัวที่เข้มงวดขึ้น ลดค่านี้เพื่อโอกาสมากขึ้น
- ความทนทานต่อการกลับตัว (พิป) (ค่าเริ่มต้น: 5): อนุญาตความทนทานในหน่วยพิปสำหรับราคาที่ขยายเกินจุดสูงสุดหรือต่ำสุดของไส้เทียนก่อนที่จะตัดสิทธิ์การกลับตัว ค่าที่น้อยกว่า (เช่น 2-3) รับประกันการยืนยันการกลับตัวอย่างเข้มงวด ในขณะที่ค่าที่มากกว่า (เช่น 5-10) รองรับการปรับฐานเล็กน้อย ปรับตามค่าพิปและความผันผวนของสัญลักษณ์
เคล็ดลับการปรับแต่ง:
- เริ่มต้นด้วยการตั้งค่าเริ่มต้นและทดสอบย้อนหลังกับข้อมูลประวัติสำหรับเครื่องมือและกรอบเวลาที่คุณชื่นชอบ
- ในตลาดที่มีแนวโน้ม เพิ่มตัวคูณเกณฑ์ไส้เทียนและอัตราส่วนไส้เทียนต่อแท่งขั้นต่ำเพื่อเน้นสัญญาณกลับตัวที่แข็งแกร่งขึ้น
- ในตลาดที่เคลื่อนไหวในกรอบแคบ ลดพารามิเตอร์เหล่านี้เพื่อจับไส้เทียนได้มากขึ้น แต่จับคู่กับช่วงเวลามองไปข้างหน้าที่สั้นลงเพื่อหลีกเลี่ยงการตัดสิทธิ์ล่าช้า
- ตรวจสอบอัตราความสำเร็จเป็นประจำและปรับพารามิเตอร์หากลดลงต่ำกว่าระดับที่ยอมรับได้ของคุณ (เช่น 70%)
โดยการปรับแต่งพารามิเตอร์เหล่านี้ เทรดเดอร์สามารถปรับตัวบ่งชี้ Long Wick ให้เหมาะสมกับกลยุทธ์เฉพาะของตน เพิ่มประสิทธิภาพในการระบุจุดกลับตัวที่มีความน่าจะเป็นสูงในสภาวะตลาดต่าง ๆ
สรุป
Traders can use the indicator to spot reversal opportunities at key support or resistance levels or against prevailing trends. It is recommended to confirm signals with other technical tools such as RSI or MACD and to apply risk management by placing stop-loss orders beyond wick extremes. The indicator’s parameters—including lookback and lookforward periods, wick threshold multiplier, SMA trend period, minimum wick-to-body ratio, and reversal tolerance—are adjustable to suit different market conditions and trading styles. Regular review of the success rate helps optimize performance.
รีวิวจากลูกค้า
5 | 0 % | |
4 | 100 % | |
3 | 0 % | |
2 | 0 % | |
1 | 0 % |


