
Açıklama
📌 Özellikler ve İşlevsellik
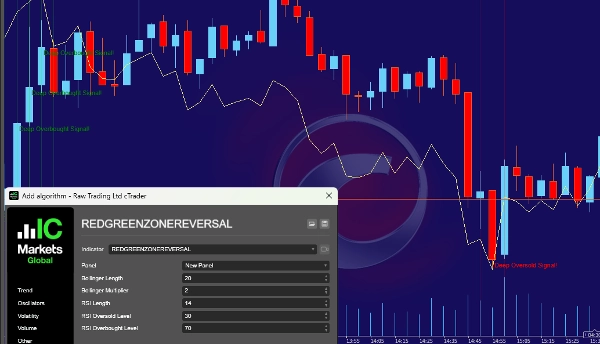
- Bollinger Bantları (20 periyotluk SMA ve 2 standart sapma)
-
- Üst bant: Aşırı alım seviyelerini gösterir.
- Alt bant: Aşırı satım seviyelerini gösterir.
- Göreceli Güç Endeksi (RSI) (14 periyot)
-
- RSI 70'in üzerinde → Piyasa aşırı alımda (aşırı alım baskısı).
- RSI 30'un altında → Piyasa aşırı satımda (aşırı satış baskısı).
- Dönüş bölgelerini tespit eder:
-
- Kırmızı Bölge (Aşırı Satım):
-
- Kapanış fiyatı alt Bollinger Bandının altında.
- RSI 30'un altında (güçlü satış baskısı).
- Anlamı: Piyasa aşırı satılmış, potansiyel bir alım fırsatı.
- Yeşil Bölge (Aşırı Alım):
-
- Kapanış fiyatı üst Bollinger Bandının üzerinde.
- RSI 70'in üzerinde (güçlü alım baskısı).
- Anlamı: Piyasa aşırı alımda, potansiyel bir satış fırsatı.
- Görsel grafik işaretçileri:
-
- Aşırı satımda kırmızı tonlu bölge (potansiyel alım fırsatı).
- Aşırı alımda yeşil tonlu bölge (potansiyel satış fırsatı).
- Uyarılar ve Ses Sinyalleri:
-
- Grafikte metin görünür (“Derin Aşırı Satım Sinyali!” veya “Derin Aşırı Alım Sinyali!”).
- Aşırı alım/aşırı satım durumu tespit edildiğinde sesli bildirimler çalar.
🎯 Bu gösterge tüccarlara nasıl yardımcı olur?
✅ Potansiyel piyasa dönüşleri için uyarı sinyalleri sağlar (aşırı fiyat seviyelerinde).
✅ Tüccarların güçlü giriş ve çıkış noktaları bulmasına yardımcı olur.
✅ Güvenilir aşırı alım/aşırı satım tespiti için Bollinger Bantları ve RSI'yi birleştirir.
✅ Farklı zaman dilimlerinde günlük işlem, swing işlem ve scalping için uygundur.
🚀 Özet:
Bu gösterge aşırı alım ve aşırı satım koşullarını tanımlamaya yardımcı olur ve fiyat dönüşünün muhtemel olduğu zamanlarda uyarır. Tüccarlar bunu akıllıca alım ve satım kararları vermek için kullanabilir!
🚨 İşlem Riski Uyarısı 🚨
Hisse senetleri, forex, kripto paralar, emtialar ve türevler dahil finansal araçlarla işlem yapmak yüksek risk içerir ve tüm yatırımcılar için uygun değildir. Herhangi bir işlem türüne başlamadan önce, ilgili riskleri anlamak ve finansal durumunuzu, deneyiminizi ve risk toleransınızı dikkatlice değerlendirmek önemlidir.
Piyasalar oldukça volatil olabilir ve fiyat hareketleri ekonomik veri açıklamaları, jeopolitik olaylar, piyasa duyarlılığı veya beklenmedik haberler nedeniyle ani ve öngörülemez olabilir. Bu volatilite önemli kazançlara yol açabilir, ancak aynı zamanda ciddi kayıplara da neden olabilir. Piyasalar pozisyonunuza karşı hızla hareket edebilir, stop-loss ve risk yönetimi stratejileri kayıpları önlemeyi garanti etmez ve kaldıraç hem kazançları hem de kayıpları artırabilir, bu da başlangıç yatırımınızı aşabilir.
Hiçbir işlem stratejisi, teknik gösterge veya yöntem kar garantisi vermez. Geçmiş performans gelecekteki sonuçları garanti etmez ve geçmiş başarı gelecekteki kazançları güvence altına almaz. Profesyonel tüccarlar bile kayıplar yaşar, piyasa koşulları sürekli değişir ve gelecekteki hareketleri kesin olarak tahmin etmek imkansızdır. İşlemler asla sadece spekülasyon veya duygulara dayanarak yapılmamalıdır.
Kaldıraç veya marj kullanımı, daha küçük bir sermaye yatırımıyla daha büyük pozisyonları kontrol etmenizi sağlar, ancak bu da riski önemli ölçüde artırır. Kaldıraç sermayenin hızla kaybedilmesine yol açabilir, marj çağrıları pozisyonların olumsuz fiyatlardan tasfiye edilmesine neden olabilir ve marjla işlem yapmak başlangıçta yatırılan paradan daha fazla para kaybetmenize yol açabilir. Ayrıca likidite riskleri ve kayma olabilir; bu, belirli bir zamanda yeterli alıcı veya satıcı olmayabileceği ve emirlerin beklenen fiyatlarda gerçekleşmeyebileceği anlamına gelir. Piyasa boşlukları ani fiyat sıçramalarına yol açabilir ve stop-loss seviyelerini tamamen atlayabilir.
İşlem yapmak disiplin, sabır ve duygusal kontrol gerektirir. Korku, açgözlülük ve aşırı özgüven genellikle kötü işlem kararlarına yol açar ve kayıp olasılığını artırır. Duygusal işlemler, düşüncesiz ve mantıksız kararlara neden olabilirken, kaçırma korkusu (FOMO) ve intikam işlemleri aşırı risk almaya yol açabilir. Net bir strateji geliştirmek ve risk yönetimi planına bağlı kalmak çok önemlidir.
Düzenleyici ve yasal riskler de göz önünde bulundurulmalıdır, çünkü farklı yargı bölgelerinin işlem ve yatırımlarla ilgili farklı düzenlemeleri vardır. Bazı finansal ürünler ülkenizde mevcut olmayabilir ve düzenleyici değişiklikler piyasa koşullarını etkileyebilir. Yerel yasalara ve finansal düzenlemelere uyduğunuzdan emin olun, saygın ve düzenlenmiş brokerlar veya borsalarla işlem yapın ve önemli finansal riskler taşıyan düzenlenmemiş platformlardan kaçının.
Teknoloji ile ilgili riskler göz ardı edilmemelidir, çünkü işlemler büyük ölçüde işlem platformlarına, internet bağlantısına ve yazılım yürütümüne bağlıdır. Yavaş internet veya sunucu sorunları nedeniyle gecikmeli yürütüm beklenmedik kayıplara yol açabilir, sistem arızaları pozisyonların planlanandan daha uzun süre açık kalmasına neden olabilir ve çevrimiçi işlem platformları kullanılırken siber güvenlik riskleri vardır.
Tüm işlem bilgileri, göstergeler, sinyaller veya araçların yalnızca eğitim amaçlı olduğunu ve finansal tavsiye olarak değerlendirilmemesi gerektiğini belirtmek önemlidir. Tüccarlar kendi araştırmalarını yapmalı ve gerekirse yatırım kararları almadan önce lisanslı bir finansal danışmana danışmalıdır. Hiçbir gösterge veya strateji sürekli karlılık garantisi vermez ve tüm işlem kararlarının sorumluluğu tamamen bireysel tüccara aittir.
İşlemde en önemli kural, kaybetmeyi göze alamayacağınız parayla asla işlem yapmamaktır. İşlem yapmak doğası gereği risklidir ve kayıplar başlangıç yatırımlarını aşabilir. Yalnızca kaybetmeye hazır olduğunuz kullanılabilir gelirle işlem yapın, asla borç para veya temel yaşam giderleriyle işlem yapmayın ve tüm fonlarınızı tek bir işlem veya varlığa yatırmamak için yatırımlarınızı çeşitlendirin.
İşlem yüksek riskli bir faaliyettir ve birincil gelir kaynağı olarak güvenilmemelidir. Birçok tüccar para kaybeder ve yalnızca küçük bir yüzde uzun vadeli karlılık elde eder. Bilinçli kararlar alın, riskleri yönetin ve her zaman sorumlu şekilde işlem yapın. Herhangi bir işlem platformu, araç veya gösterge kullanarak, işlemle ilişkili riskleri kabul etmiş olursunuz.
Sorumlu işlem yapın. Bilgili kalın. Sermayenizi koruyun. 🚀
Özet
- Red Zone (Oversold): Closing price below the lower Bollinger Band and RSI below 30, signaling strong selling pressure and a potential buying opportunity.
- Green Zone (Overbought): Closing price above the upper Bollinger Band and RSI above 70, indicating strong buying pressure and a potential selling opportunity.
Visual markers include red-shaded zones for oversold conditions and green-shaded zones for overbought conditions. Alerts are provided via on-chart text notifications ("Deep Oversold Signal!" or "Deep Overbought Signal!") and sound signals when these conditions occur.
This tool assists traders by providing warning signals for potential market reversals at extreme price levels, helping to identify strong entry and exit points. It is suitable for various trading styles, including day trading, swing trading, and scalping, across different timeframes. The indicator supports markets such as forex, stocks, indices, and commodities.
Müşteri değerlendirmeleri
5 | 100 % | |
4 | 0 % | |
3 | 0 % | |
2 | 0 % | |
1 | 0 % |


