
설명
Pinescriptlabs 스토어 지표: Pinescriptlabs 스토어 cBots : (cBot) Gold & BTC BreakoutSession Pivots(new)
Trailing Smart Algorithm (New)
Prediction Based on Linreg & ATR
SmartTrend Support &
Resistance
Lines
Dynamic
Market Structure
Analysis
of
Turning
Points
Fibonacci
Linear
Regression
Multi-timeframe
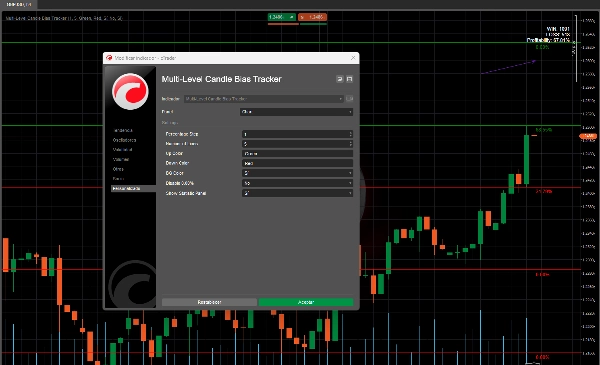
Multi-Level
Candle Bias
Tracker
Auto
Support and
Resistance
Trend
Lines
All
Support and
Resistance
Levels
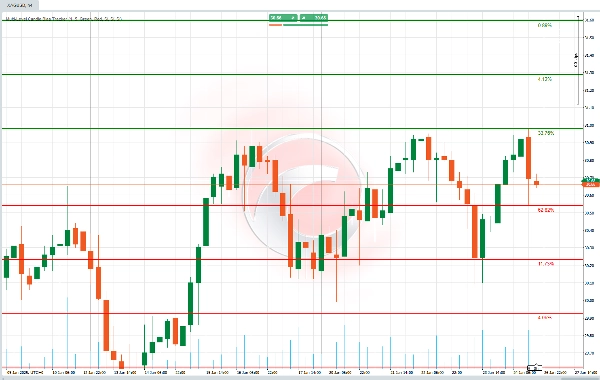
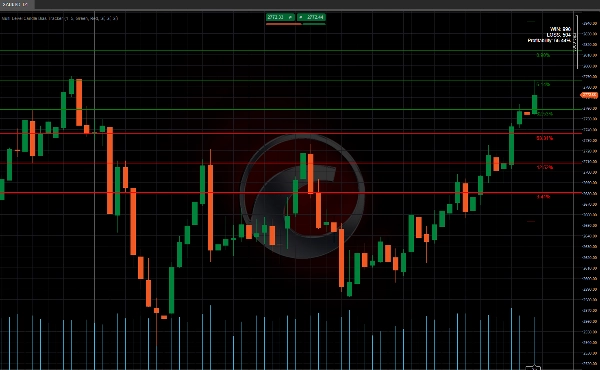
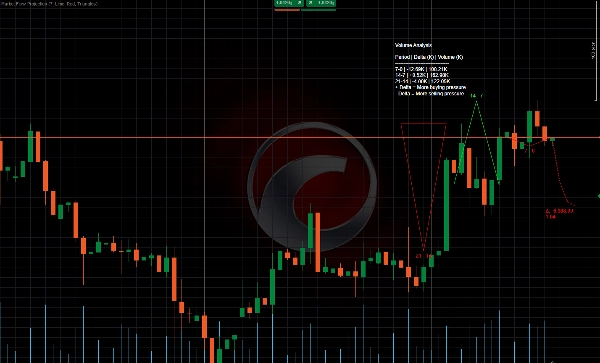
이 알고리즘은 가격이 새로운 고점 또는 저점에 도달할 가능성을 결정하고, 이를 차트상의 레벨과 해당 백분율로 표시합니다. 이 계산은 백테스트되며, 결과는 표로 나타나 다음 캔들이 새로운 고점 또는 저점을 설정할 확률을 쉽게 이해할 수 있게 합니다. 📈📉
작동 원리 🛠️
- 새로운 고점과 저점의 확률 🎯
-
- 알고리즘은 과거 가격 행동을 분석하여 다음 캔들에서 가격이 새로운 고점 또는 저점을 만들 확률을 계산합니다.
- 예를 들어, 새로운 고점 확률이 70%라면 가격이 상승할 가능성이 더 높습니다. ⬆️
- 백분율이 포함된 레벨 📏
-
- 차트에 주요 레벨을 나타내는 수평선을 그리고, 가격이 해당 레벨에 도달할 확률을 백분율로 표시합니다.
- 이 레벨들은 사용자가 정의한 백분율(예: 1%)을 사용해 계산됩니다.
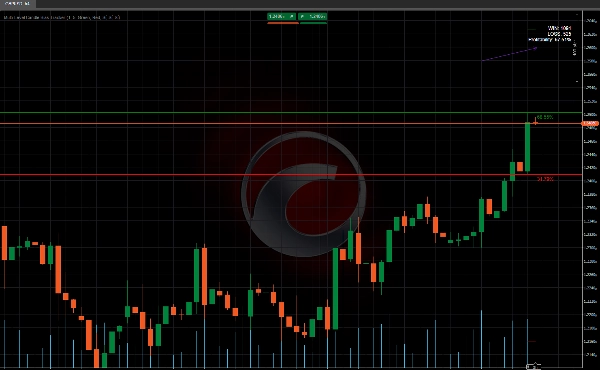
- 통계 패널 📊
-
- 가격이 해당 레벨에 도달한 횟수(성공)와 도달하지 못한 횟수를 보여줍니다.
- 또한 효과성 백분율을 제공하여 과거에 해당 레벨들이 얼마나 신뢰할 만했는지 알려줍니다. ✅❌
용도는?
- 가격 방향 이해: 다음 캔들에서 가격이 상승할지 하락할지 알 수 있도록 도와줍니다. ⬆️⬇️
- 위험 관리: 확률이 낮은 레벨은 피하여 위험한 결정을 줄일 수 있습니다.
어떻게 사용하나요?
- 레벨 관찰하기: 알고리즘이 차트에 그리는 선들을 봅니다. 👀
- 확률 확인하기: 레벨의 확률이 높으면(예: 70%) 가격이 그 레벨에 도달할 가능성이 더 큽니다. 📈
- 통계 패널 활용하기: 과거에 해당 레벨들이 얼마나 잘 작동했는지 검토하여 신뢰할지 결정합니다. 📊
요약
The indicator includes a statistics panel that shows how many times the price has successfully reached these levels versus how many times it has not, along with an effectiveness percentage reflecting the reliability of these levels based on historical data.
This tool is designed to help traders understand the likely direction of price movement in the next candle and manage risk by avoiding levels with low probabilities. Users apply it by observing the drawn levels, checking their associated probabilities, and reviewing the statistics panel to assess the historical performance of these signals.
Supported markets include commodities, cryptocurrencies (e.g., BTCUSD), and other symbols. The indicator integrates probability-based analysis into price action trading to assist in decision-making regarding potential breakout or trend continuation scenarios.
고객 리뷰
5 | 100 % | |
4 | 0 % | |
3 | 0 % | |
2 | 0 % | |
1 | 0 % |


