
RISK V1
Gösterge
Sürüm 1.0, Apr 2025
Windows, Mac
5.0
Değerlendirmeler: 1
Açıklama
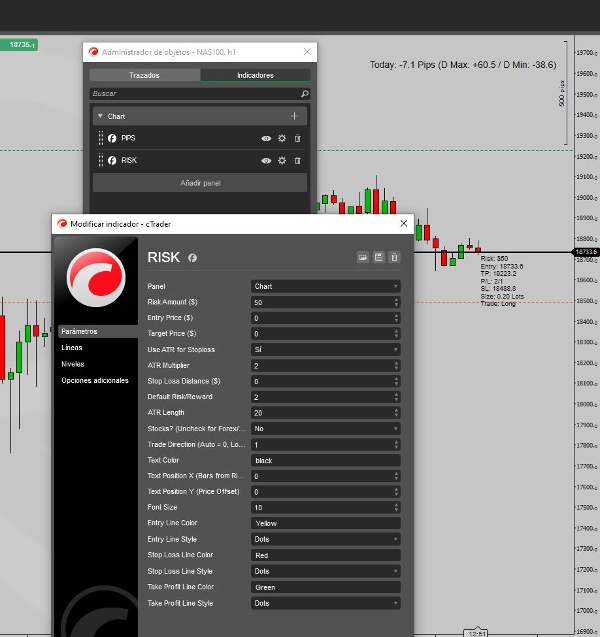
Verilen cAlgo göstergesi, AutoPositionSizingRR, risk, stop loss ve kar alma seviyelerine dayalı olarak pozisyon büyüklüklerini otomatik hesaplamaya ve yönetmeye yardımcı olmak için tasarlanmıştır. Özelleştirilebilir ve hem hisse senedi hem de forex piyasalarına uygulanabilir, ticaret kurulumu hakkında ayrıntılı bilgi sağlar. İşte temel işlevselliği ve özelliklerinin bir özeti:
Temel Özellikler:
- Risk Temelli Pozisyon Büyüklüğü: Belirtilen risk miktarına ve giriş fiyatı ile stop loss arasındaki mesafeye göre optimal lot büyüklüğünü hesaplar.
- Özelleştirilebilir Parametreler: Kullanıcılar risk miktarı, giriş fiyatı, hedef fiyat, stop loss mesafesi, ATR çarpanı ve daha fazlası gibi parametreleri ayarlayabilir, böylece kişiselleştirilmiş risk yönetimi sağlar.
- Dinamik Stop Loss ve Kar Alma: Sabit mesafe, ATR (Ortalama Gerçek Aralık) veya önceden tanımlanmış risk/ödül oranına göre stop loss ve kar alma hesaplayabilir.
- Forex ve Hisse Senedi Desteği: Hem forex hem de hisse senedi piyasalarını destekler, işlem yapılan enstrümana göre hesaplamaları ayarlar.
- Görsel Kurulum: Giriş, stop loss ve kar alma için grafikte yatay çizgiler çizer, ticaret kurulumunun kolay görsel temsilini sağlar. Ayrıca giriş fiyatı, stop loss, kar alma, lot büyüklüğü ve işlem türü gibi önemli bilgileri doğrudan grafikte gösterir.
Nasıl Çalışır:
- Girdiler: Kullanıcı risk miktarını (USD cinsinden), giriş fiyatını, hedef fiyatı ve stop loss mesafesini (sabit veya ATR’ye dayalı) ayarlar. ATR (Ortalama Gerçek Aralık), volatil piyasalarda stop loss mesafesini hesaplamak için kullanılabilir.
- Hesaplama: Script, risk miktarını stop loss mesafesine (pip veya dolar değeri cinsinden, forex veya hisse senedi işlemine bağlı olarak) bölerek pozisyon büyüklüğünü otomatik olarak hesaplar.
- Ticaret Bilgisi: Giriş fiyatı, stop loss, kar alma ve belirtilen risk seviyesini korumak için gereken lot büyüklüğü gibi gerçek zamanlı bilgileri grafikte gösterir.
Görsel Özellikler:
- Grafik Çizgileri: Giriş, stop loss ve kar alma seviyelerini grafikte yatay çizgiler olarak çizer.
- Metin Bindirmesi: Grafik üzerinde biçimlendirilmiş ticaret detaylarını (risk, giriş, TP, SL, lot büyüklüğü vb.) özelleştirilebilir metin konumu, renk ve yazı tipi boyutuyla gösterir.
Kullanım:
- Bu gösterge, tanımlanmış bir risk eşiğine dayalı olarak pozisyon büyüklüklerini hesaplama sürecini otomatikleştirmek isteyen günlük işlemciler, swing traderlar ve scalperlar için faydalıdır. Ticaret yönetimini kolaylaştırır ve doğrudan grafikte görsel ipuçları ve ticaret bilgileri sunarak daha verimli karar vermeye olanak tanır.
Örnek:
- Bir trader, 50$ risk miktarı, 100$ giriş fiyatı belirleyebilir ve stop loss hesaplaması için ATR kullanabilir. Script optimal pozisyon büyüklüğünü hesaplar, giriş, stop loss ve kar alma seviyelerini grafikte çizer ve risk miktarı, stop loss ve potansiyel kar gibi önemli ticaret detaylarını gösterir.
Bu araç, risk yönetimini önceliklendiren ve işlemlerini görsel olarak entegre bir şekilde yönetmek isteyen traderlar için idealdir.
Özet
Gösterge profili
Müşteri değerlendirmeleri
5.0
Değerlendirmeler: 1
5 | 100 % | |
4 | 0 % | |
3 | 0 % | |
2 | 0 % | |
1 | 0 % |
Müşteri değerlendirmeleri
April 29, 2025
it helps the review without running the trade, but it should stay as one part of the stack.
Tartışma
SSS
Forex
ATR
cTrader Store üzerinden erişilebilen işlem botları, göstergeler ve eklentiler gibi ürünler, üçüncü taraf sağlayıcılar tarafından sağlanır ve yalnızca bilgilendirme ve teknik erişim amaçlarıyla sunulur. cTrader Store bir broker değildir ve yatırım tavsiyesi, kişisel öneriler vermez veya gelecekteki performansı garanti etmez.
Bu oluşturanın diğer ürünleri


Fiyat
Başlangıç 13/01/2025
2
Satışlar