
Mô tả
Chỉ Báo Thời Gian Hòa Vốn v2
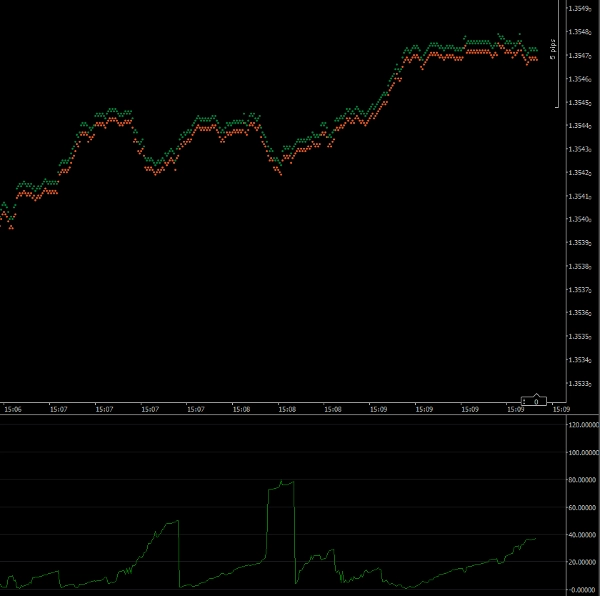
Chỉ báo này sẽ giúp bạn xác định thời điểm vào lệnh giao dịch trên thị trường. Đồ thị hiển thị số giây ước tính để giao dịch của bạn hòa vốn. Nếu thị trường di chuyển nhanh và theo hướng của bạn, chỉ báo sẽ cho số nhỏ. Nếu thị trường di chuyển ngược lại hoặc chậm, số sẽ lớn hơn.
Chỉ báo tính toán số pip mà giao dịch của bạn cần để hòa vốn. Sau đó nó so sánh với tốc độ hiện tại mà giá đang di chuyển.
Lưu ý: Chỉ báo này nên chạy trên Khung Thời Gian 1 Tick.
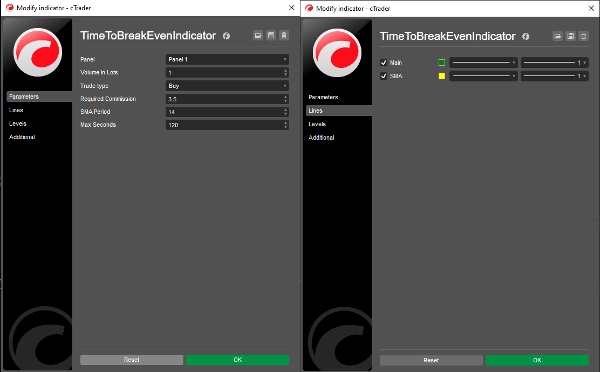
Tham Số
Khối lượng theo Lots: Khối lượng giao dịch dự kiến của bạn
Loại Giao Dịch: Giao dịch của bạn là mua hay bán
Hoa Hồng Yêu Cầu: Hoa hồng mà giao dịch của bạn sẽ phải chịu (bạn có thể lấy thông tin này từ cửa sổ Giao Dịch Nhanh)
Chu Kỳ SMA: Chu kỳ của đường Trung Bình Động Đơn Giản (mặc định = 14)
Số Giây Tối Đa: Số giây tối đa sẽ được ghi nhận (xem bên dưới)
Các Đường
Chính: Đường biểu diễn chỉ báo (mặc định = màu xanh lá)
SMA: Đường Trung Bình Động Đơn Giản (mặc định = màu vàng)
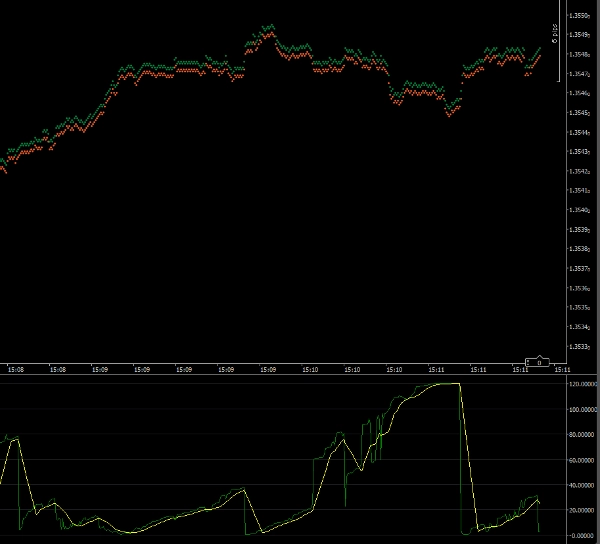
Số Giây Tối Đa
Cho phép chỉ báo hiển thị các giá trị rất lớn sẽ khiến thang đo của chỉ báo ngăn bạn nhìn thấy chi tiết khi thời gian hòa vốn nhỏ. Thiết lập tham số này cho phép bạn đặt thang đo tối đa của chỉ báo. Mặc định được đặt là 120 (2 phút). Vì vậy bất kỳ kết quả nào từ 2 phút trở lên sẽ được biểu diễn là 120 giây.
Tiến sĩ Andy Larkin
Bản quyền 2025, Bảo lưu mọi quyền
Ngày 26 tháng 5 năm 2025
Pháp Lý
Kết quả từ chỉ báo này nên được kiểm tra độ chính xác trước khi sử dụng trong giao dịch thực tế.
Không có bảo đảm nào được đưa ra hoặc ngụ ý cho kết quả của chỉ báo này.
Không chịu trách nhiệm cho bất kỳ tổn thất nào phát sinh do việc sử dụng chỉ báo này.
Tóm tắt
Đánh giá của khách hàng
5 | 50 % | |
4 | 50 % | |
3 | 0 % | |
2 | 0 % | |
1 | 0 % |


