
FullTrendReversalmoagi2
指标
版本 1.0, Jul 2025
Windows 版、Mac 版
说明
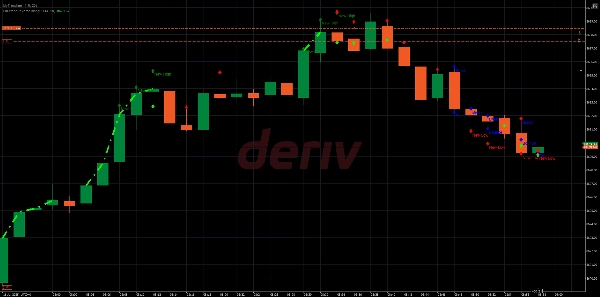
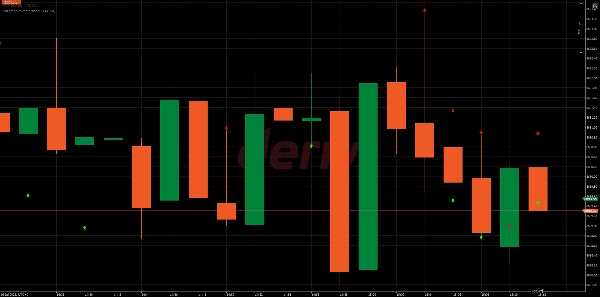
FullTrendReversalmoagi2 是一个为 cTrader 定制的支撑和阻力指标,专为帮助交易者清晰精准地定位潜在的反转区域和趋势延续而设计。
🔹 核心功能:
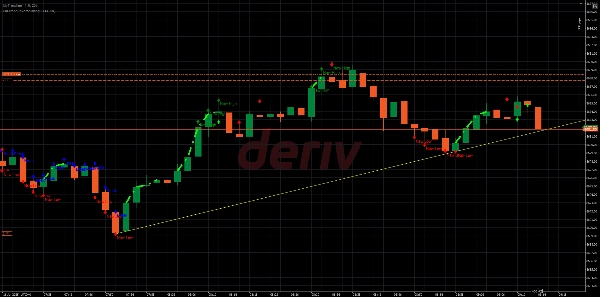
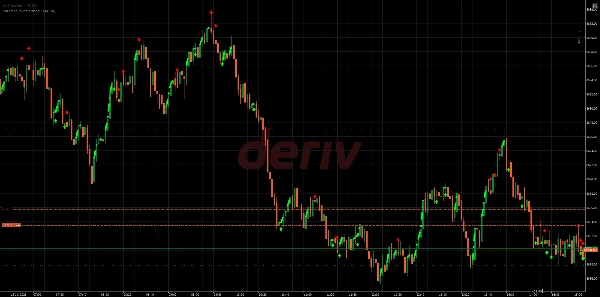
• 动态绘制基于近期市场结构的 支撑 和 阻力 水平。
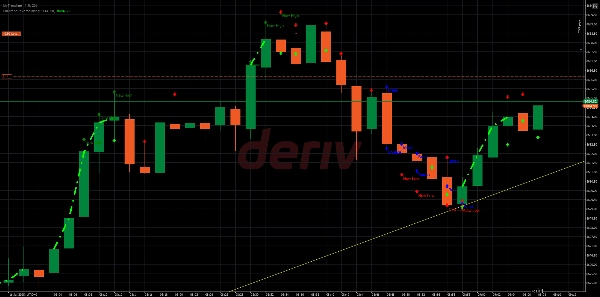
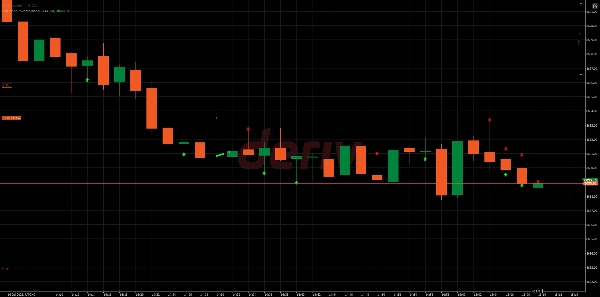
• 显示 红色箭头,指示价格可能向下反转的看跌阻力区。
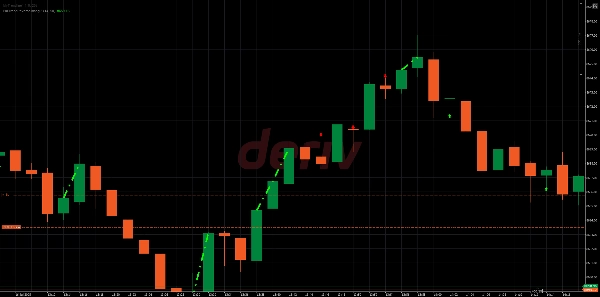
• 显示 绿色箭头,指示价格可能向上反弹的看涨支撑区。
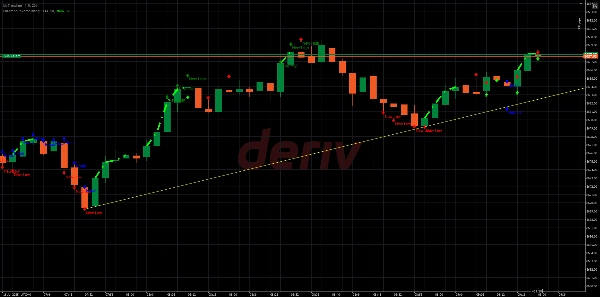
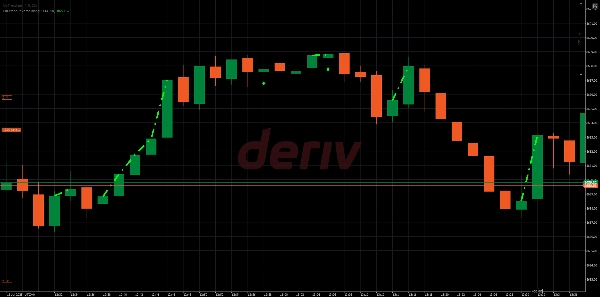
• 绘制 绿色虚线趋势线,以指示活跃的看涨趋势阶段。
• 在图表上标记 新高和新低,帮助可视化不断变化的市场动能。
🔹 使用方法:
• 当价格对红色或绿色箭头作出反应时进行反转交易。
• 利用虚线趋势线作为当前趋势确认,进行趋势延续交易。
✨ 与 MyTrendLine1 指标完美搭配,该指标检测趋势线的反弹和突破,帮助交易者在关键水平确认反转或延续,减少错误信号。
摘要
指标配置
客户评价
0.0
评价:0
客户评价
该产品尚无评价。已经试过了?抢先告诉其他人!
讨论
常见问答
cTrader Store 提供的所有产品,包括交易机器人、指标和插件,均由第三方开发者提供,仅供信息参考和技术访问之用。cTrader Store 并非经纪商,不提供投资建议、个人推荐或任何未来业绩保证。
猜您喜欢


价格
注册日期 18/05/2025
85.69M
交易量
38.62M
盈利点数