Mô tả
⚠️ Chúng tôi đã chuyển sang 👉 PrimeQuant
🚫🚫🚫 Đừng mua chỉ báo này!
Chỉ báo OHLC PRO của LudwigICT là một công cụ phủ biểu đồ đa tính năng được thiết kế để cung cấp một hình ảnh chuyên nghiệp, giàu thông tin trên biểu đồ cTrader của bạn.
Dưới đây là phân tích về những gì nó làm:
🔹 Chức năng chính: Phủ OHLC
- Vẽ các thanh OHLC tùy chỉnh (Mở, Cao, Thấp, Đóng) trên biểu đồ của bạn.
- Bạn có thể thiết lập:
-
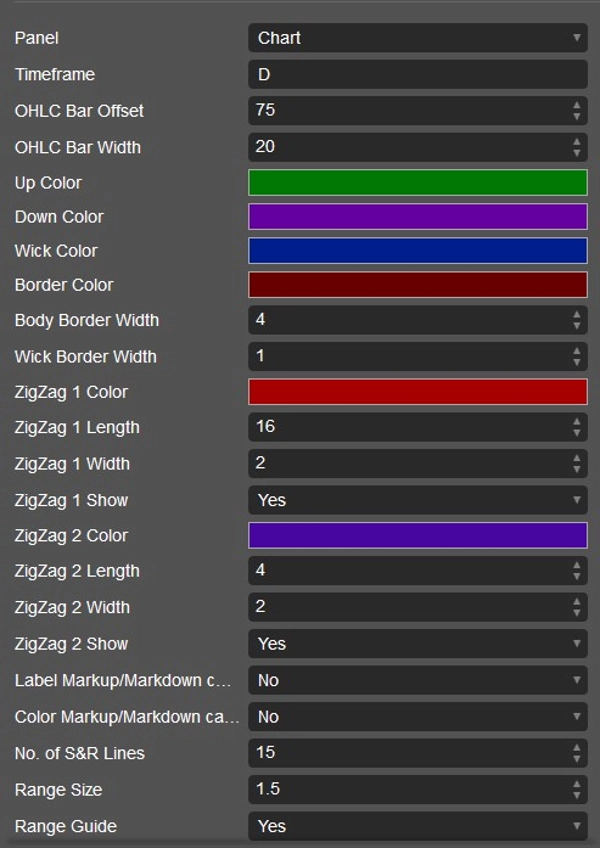
- Thời gian OHLC nào được sử dụng (Hàng ngày, Hàng tuần, Hàng tháng, hoặc trong ngày như H1, M15, v.v.).
- Độ lệch thanh (khoảng cách từ nến hiện tại).
- Chiều rộng thanh, bấc, viền và màu sắc tùy chỉnh.
- Hiệu quả, bạn nhận được “nến tham chiếu” từ các khung thời gian cao hơn được đặt trên biểu đồ hiện tại của bạn.
🔹 Cài đặt Triple-M (Tín hiệu Tăng/Giảm)
- Phát hiện mẫu các đáy cao hơn liên tiếp (tăng giá) hoặc đỉnh thấp hơn (giảm giá).
- Khi phát hiện:
-
- Có thể đặt biểu tượng tam giác (lên hoặc xuống) trên các nến.
- Cũng có thể đổi màu các thanh để hiển thị sự chuyển động động lực.
- Điều này hoạt động như một tín hiệu thay đổi cấu trúc động lực.
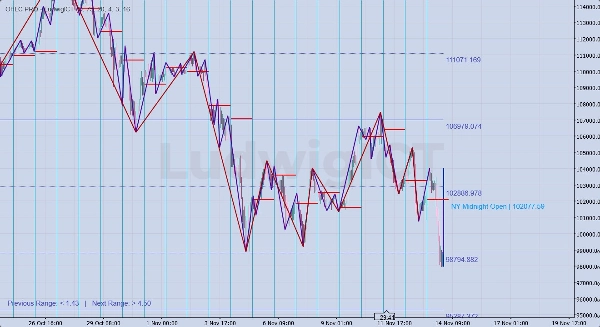
🔹 Công cụ ZigZag Đôi
- Hai lớp phủ ZigZag độc lập:
-
- ZigZag #1 (độ dài lớn hơn, ví dụ cấu trúc dao động).
- ZigZag #2 (độ dài nhỏ hơn, ví dụ dao động vi mô).
- Nổi bật các dao động thị trường cho phân tích cấu trúc, xu hướng và phá vỡ.
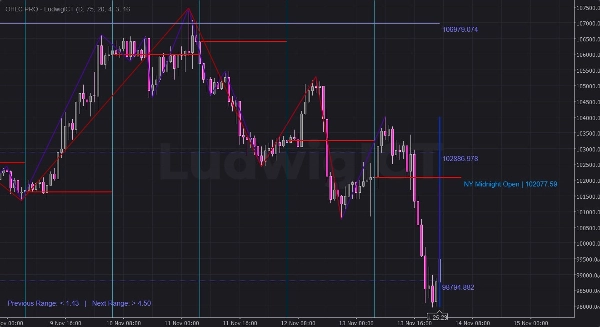
🔹 Hỗ trợ & Kháng cự Gann
- Sử dụng bảng số Gann + logic ATR để tính toán các mức S/R.
- Vẽ nhiều đường hỗ trợ/kháng cự trên và dưới giá.
- Các đường có thể được định dạng (đường liền, chấm, mở rộng sang trái, v.v.).
- Gắn nhãn các mức với giá trị.
- Cũng cung cấp Hướng dẫn Phạm vi:
-
- “Phạm vi Trước” so với “Phạm vi Tiếp theo” liên quan đến ATR.
- Giúp dự báo các vùng mở rộng hoặc co lại.
🔹 Mức Đóng cửa Nửa đêm New York
- Tự động phát hiện giá mở cửa nửa đêm phiên New York.
- Vẽ:
-
- Đường ngang tại giá mở cửa nửa đêm NY.
- Đường dọc tại thời điểm bắt đầu phiên.
- Nhãn hiển thị “NY Midnight Open | giá”.
- Bạn có thể kéo dài các đường này trong 1 hoặc 2 ngày, hoặc thêm giờ bổ sung.
- Hữu ích cho giao dịch kiểu ICT (xu hướng phiên New York, điểm cân bằng, v.v.).
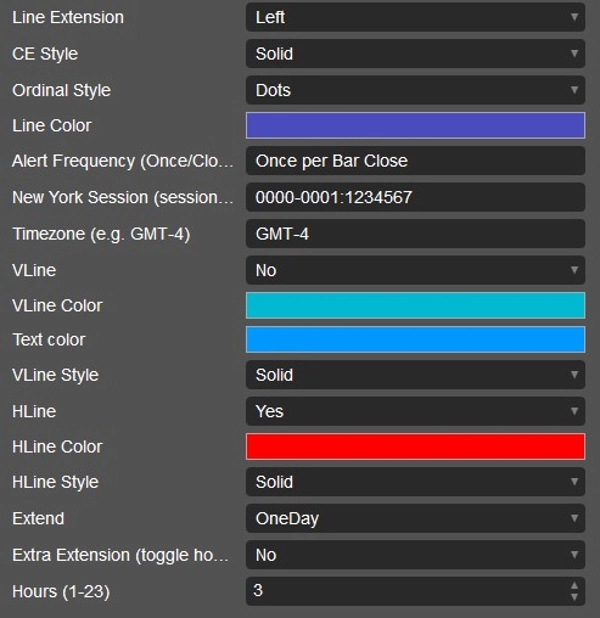
🔹 Tùy chỉnh & Cảnh báo
- Mỗi tính năng có các tham số trong menu thả xuống:
-
- Màu sắc, kiểu dáng, mở rộng đường, số lượng đường, v.v.
- Hỗ trợ cảnh báo (chủ yếu qua hình ảnh biểu đồ—có tham số tần suất cảnh báo).
- Loại bỏ sạch sẽ khi đóng chỉ báo (để biểu đồ của bạn không bị lộn xộn).
✅ Tóm lại:
Chỉ báo này là một công cụ hành động giá đa năng. Nó kết hợp:
- Nến OHLC khung thời gian cao hơn
- Tín hiệu mẫu động lực (Triple-M)
- Hai cấu trúc ZigZag
- Mức S/R Gann + hướng dẫn phạm vi
- Các dấu hiệu mở cửa nửa đêm phiên New York
Nó được tạo ra cho giao dịch dựa trên cấu trúc, phiên và mức giá, đặc biệt hữu ích cho các nhà giao dịch kiểu ICT hoặc hành động giá.
Tôi giải thích cách bạn có thể sử dụng nó một cách thực tế khi giao dịch XAU/USD
🔹 Sử dụng Giao dịch Thực tế (Vàng với OHLC PRO)
1. Phủ OHLC Khung Thời gian Cao hơn
- Ví dụ: Vẽ OHLC Hàng ngày khi giao dịch trên M5/M15.
- Bạn sẽ thấy nến ngày hôm qua “bên trong” biểu đồ trong ngày của bạn.
- Cách sử dụng:
-
- Giá tiếp cận đỉnh/đáy ngày trước = khu vực săn thanh khoản.
- Mở/đóng hàng ngày = bộ lọc xu hướng (trên = tăng, dưới = giảm).
- Giúp bạn giao dịch trong phạm vi hàng ngày.
👉 Trên vàng, phiên NY thường tấn công vào đỉnh/đáy ngày trước trước khi đảo chiều.
2. Tín hiệu Triple-M
- Mẫu Triple-M (chuỗi đáy tăng hoặc đỉnh giảm) = động lực ngắn hạn.
- Cách sử dụng:
-
- Triple-M tăng gần hỗ trợ (đáy HTF hoặc mở cửa nửa đêm NY) → có thể mua lướt sóng.
- Triple-M giảm gần kháng cự (đỉnh HTF hoặc mức Gann) → có thể bán lướt sóng.
- Có thể đổi màu thanh để nhận biết nhanh trong các biến động vàng nhanh.
👉 Hoạt động tốt cho vào lệnh chính xác trên M1–M5 khi phù hợp với xu hướng HTF.
3. ZigZag Đôi
- ZigZag #1 (độ dài lớn hơn) = cấu trúc dao động.
- ZigZag #2 (độ dài nhỏ hơn) = cấu trúc vi mô.
- Cách sử dụng:
-
- Xác định các điểm phá vỡ cấu trúc thị trường (BOS/CHOCH).
- Chỉ giao dịch theo hướng của ZigZag lớn hơn (#1).
- Dùng ZigZag nhỏ hơn (#2) để xác nhận vào lệnh.
👉 Ví dụ: Xu hướng hàng ngày tăng → chờ ZigZag #2 chuyển tăng gần hỗ trợ HTF.
4. Hỗ trợ & Kháng cự Gann
- Tạo lưới các mức S/R toán học.
- Cách sử dụng:
-
- Nếu giá đang tích lũy, các mức đánh dấu các điểm phá vỡ mở rộng có khả năng xảy ra.
- Kết hợp với hướng dẫn phạm vi ATR:
-
- "Phạm vi Trước" nhỏ → dự đoán sự mở rộng biến động.
- "Phạm vi Tiếp theo" cao → mức phá vỡ mạnh sắp tới.
👉 Trên vàng, các mức Gann thường trùng với các số tròn (ví dụ 2400, 2420, 2435).
5. Mở cửa Nửa đêm New York
- Đây là một trong những công cụ ICT mạnh mẽ nhất cho vàng.
- Cách sử dụng:
-
- Giá so với mở cửa nửa đêm NY = xu hướng định hướng.
- Nếu giá giữ trên mức mở cửa nửa đêm → phiên NY tăng giá.
- Nếu dưới → xu hướng giảm.
- Đường ngang đóng vai trò như tham chiếu cân bằng (50%).
- Chú ý các đợt quét thanh khoản quanh mức này trong các vùng killzone London/NY.
👉 Ví dụ:
Mở cửa nửa đêm NY = 2405.
- Nếu London đẩy giá xuống 2398 và NY lấy lại 2405 → thiết lập mua mạnh.
🔑 Kết hợp lại (Ví dụ Cài đặt)
- Bắt đầu phiên NY:
-
- Vẽ OHLC Hàng ngày.
- Ghi chú mở cửa nửa đêm NY.
- Theo dõi các mức Gann gần đó.
- Chờ bắt thanh khoản (tấn công Đỉnh/Đáy Hàng ngày hoặc S/R Gann).
- Kiểm tra Triple-M / ZigZag #2 để xác nhận tăng/giảm vi mô.
- Vào lệnh với dừng lỗ phía sau đợt quét thanh khoản.
- Mục tiêu là phía đối diện của phạm vi hoặc mức Gann/HTF tiếp theo.
✅ Tóm lại:
- OHLC Hàng ngày + Mở cửa nửa đêm NY = bộ lọc xu hướng.
- ZigZag + Triple-M = thời điểm vào lệnh.
- Gann + Hướng dẫn Phạm vi = mục tiêu lợi nhuận & tín hiệu mở rộng.
Chỉ báo này cơ bản cung cấp cho bạn tất cả các công cụ kiểu ICT trong một gói cho XAU/USD.
Nếu bạn có bất kỳ câu hỏi nào hoặc gặp phải vấn đề gì, hãy liên hệ với tôi. Tôi rất vui được giúp bạn!
Tuyên bố từ chối trách nhiệm:
Bằng cách sử dụng các thuật toán của tôi, bạn thừa nhận rằng giao dịch có rủi ro vốn có và hiệu suất trong quá khứ không đảm bảo kết quả trong tương lai. Việc có một chiến lược quản lý rủi ro vững chắc là rất quan trọng và trên hết, bạn phải giữ kỷ luật trong việc tuân thủ các mức dừng lỗ. Việc không quản lý rủi ro đúng cách có thể dẫn đến thua lỗ đáng kể. Tôi không chịu trách nhiệm về bất kỳ kết quả tài chính nào phát sinh từ việc sử dụng các thuật toán này. Hãy giao dịch có trách nhiệm và luôn tuân thủ các thực hành quản lý rủi ro đúng đắn.
Chúc bạn thành công! 🙌
Tóm tắt
Đánh giá của khách hàng
5 | 100 % | |
4 | 0 % | |
3 | 0 % | |
2 | 0 % | |
1 | 0 % |


