
Market Profile Pro - Advanced Volume Analysis for cTrader
Professional Market Profile Analysis Tool
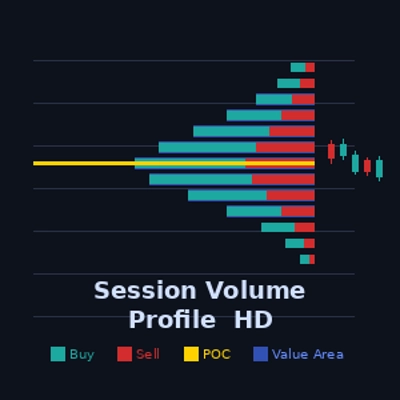
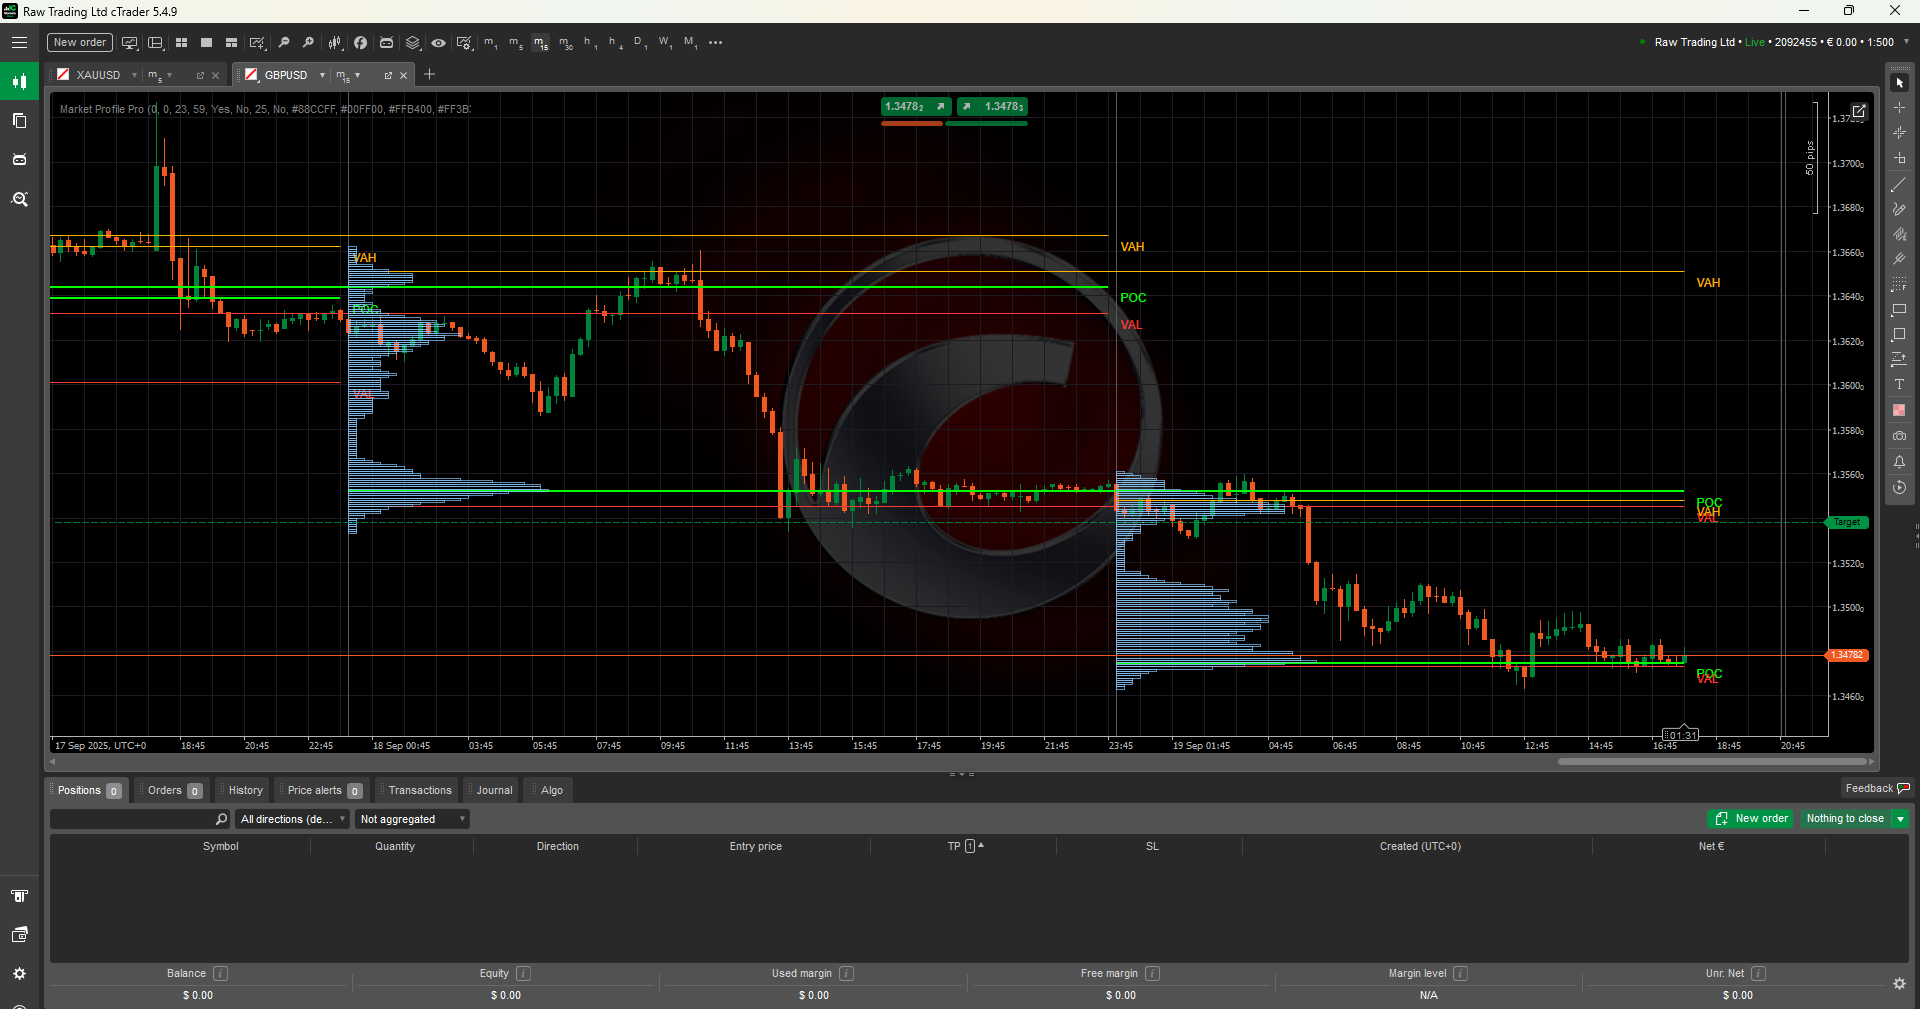
Market Profile Pro is a sophisticated volume-based indicator that displays real-time volume distribution across price levels. This professional tool helps traders identify key price zones and market structure for informed trading decisions.
🎯 Key Features
Core Functionality
- Real-time Volume Profile Calculation - Live updates as market develops
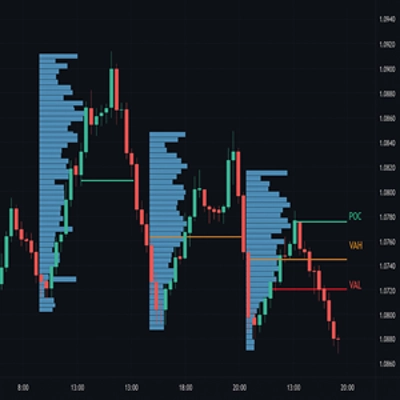
- Point of Control (POC) - Identifies price levels with highest trading activity
- Value Area High/Low (VAH/VAL) - Marks boundaries containing 70% of session volume
- Session-Based Profiles - Customizable session times with precise controls
- Multi-Day Analysis - View up to 100 historical sessions simultaneously
Visual Customization
- Transparent Histograms - Adjustable opacity (10-100%) for clean display
- Custom Color Schemes - Full hex color support for all elements
- Scalable Histogram Width - Adaptive sizing based on timeframe
- Compact Mode - Toggle labels for streamlined appearance
- Professional Display - Industry-standard visualization
Advanced Controls
- Profile Limit Management - Control profile display count (1-100)
- Current Session Focus - Option to show only active session
- Precision Tick Size - Configurable for any instrument
- Memory Optimization - Automatic cleanup of historical data
- Session Templates - Pre-configured for major market hours
📈 Applications
Market Structure Analysis
- Volume Nodes - Identify high-activity price zones
- Price Distribution - Understand volume acceptance levels
- Market Balance - Analyze price and volume relationships
Support & Resistance
- POC Levels - Point of Control as key reference zones
- Value Area Boundaries - VAH/VAL as natural price limits
- Volume Analysis - High volume areas as significant levels
Trading Applications
- Market Context - Volume profile validates price movements
- Zone Identification - Clear visualization of important price areas
- Structure Analysis - Understand market development patterns
⚙️ Configuration Options
Session Management
- Start Time: Hour/Minute precision for session beginning
- End Time: Customizable session close with overnight handling
- Multi-Session: Track multiple market sessions simultaneously
- Time Zone: UTC-based with automatic adjustments
Display Settings
- Histogram Width: 2-200 pixels for optimal chart fitting
- Profile Opacity: 10-100% transparency control
- Color Customization: Full hex color support (#RRGGBB format)
- Label Management: Show/hide POC, VAH, VAL text labels
Performance Controls
- Days Back: Limit historical data (1-100 days)
- Max Profiles: Control visible profile count
- Tick Precision: Instrument-specific price level settings
🎨 Visual Excellence
Market Profile Pro delivers professional visualization:
- Semi-transparent histograms blend with price action
- Proportional volume bars represent trading activity accurately
- Clean line work for POC, VAH, and VAL levels
- Smart label positioning maintains chart clarity
- Adaptive sizing works across all timeframes
📊 Technical Specifications
Compatibility
- Platform: cTrader (cAlgo framework)
- Instruments: Forex, Indices, Commodities, Cryptocurrencies
- Timeframes: All timeframes supported (M1 to Monthly)
- Data Requirements: Standard tick volume data
Performance
- Real-time Updates: Fast calculation updates
- Memory Efficient: Automatic historical data management
- CPU Optimized: Minimal platform performance impact
- Scalable: Handles high-frequency data smoothly
💼 Professional Benefits
Analysis Enhancement
- Market Context: Volume distribution for better market understanding
- Structure Recognition: Clear visualization of market development
- Zone Identification: Important price levels highlighted automatically
Decision Support
- Visual Clarity: Clean presentation of complex volume data
- Historical Context: Multiple session analysis capability
- Real-time Updates: Current market development tracking
Workflow Improvement
- Time Efficiency: Automated volume profile calculations
- Customization: Adapt display to personal preferences
- Reliability: Consistent, accurate market analysis tool
🏆 Professional Advantages
Compared to Basic Tools
- Advanced calculations - Professional-grade algorithms
- Visual quality - Clean, customizable appearance
- Reliable performance - Stable calculations and display
- Full customization - Every aspect configurable
- Developer support - Assistance and regular updates
Value Benefits
- Time Savings: Automated volume distribution analysis
- Clear Visualization: Professional market structure display
- Comprehensive Tool: Complete volume profile solution
- Universal Application: Works across all markets and timeframes
📋 Installation & Setup
- Download the .algo file
- Import into cTrader via cAlgo editor
- Compile and add to your charts
- Configure session times and visual preferences
- Begin Analysis with professional market profile tools
🎯 Ideal For
- Active Traders seeking volume-based market analysis
- Technical Analysts requiring professional visualization tools
- Market Students learning volume and market structure concepts
- Professional Traders needing reliable analysis tools
- Educators teaching market structure and volume analysis
📞 Support & Updates
- Email Support: Direct developer assistance
- Regular Updates: New features and improvements
- Documentation: Comprehensive user guide included
- Setup Assistance: Installation and configuration help
Enhance your market analysis with professional volume profile visualization. A comprehensive tool for serious market analysis and structure understanding.
Compatible with all cTrader brokers. Professional license with ongoing support.