ADX advanced
Chỉ báo
Phiên bản 1.0, Apr 2026
Windows, Mac
4.3
Đánh giá: 3
Mô tả
Hệ Thống Đám Mây & Đà Tiến Tiến Tiến ADX Nâng Cao
Chỉ số Trung bình Hướng (ADX) tiêu chuẩn là một công cụ mạnh mẽ, nhưng hãy thành thật: nhìn chằm chằm vào ba đường giao nhau (+DI, -DI và ADX) thật lộn xộn, gây nhầm lẫn và làm mỏi mắt bạn.
Chỉ báo ADX Nâng Cao hoàn toàn hiện đại hóa công cụ cổ điển này. Nó biến những đường hỗn loạn thành một sức mạnh trực quan rõ ràng cho bạn biết chính xác AI đang kiểm soát (Bò hay Gấu) và XU HƯỚNG MẠNH NHƯ THẾ NÀO, tất cả chỉ trong một cái nhìn.
Các Tính Năng Chính
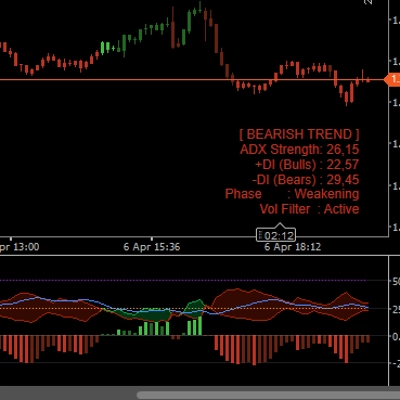
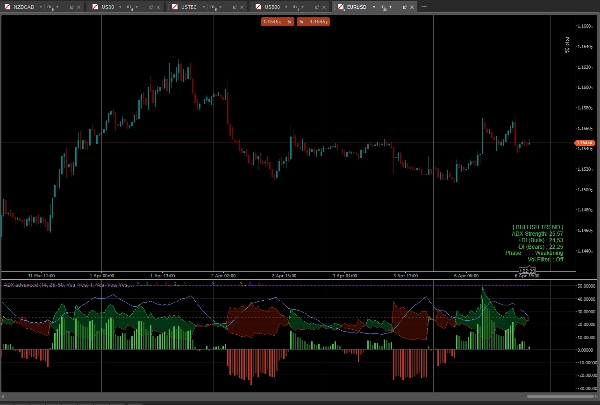
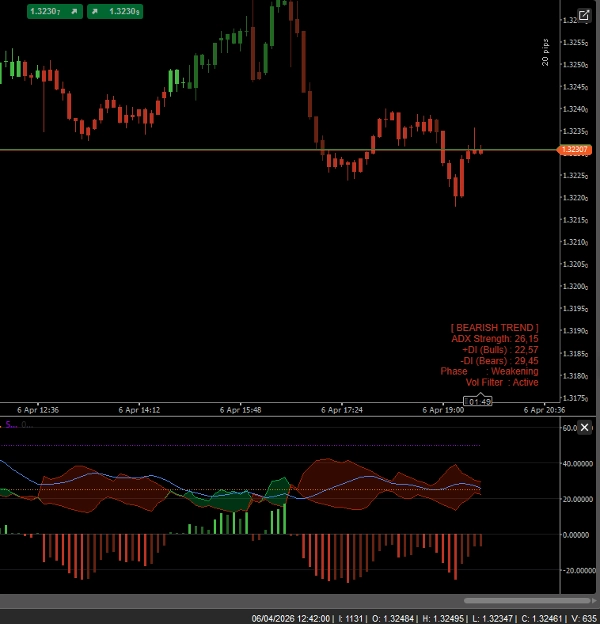
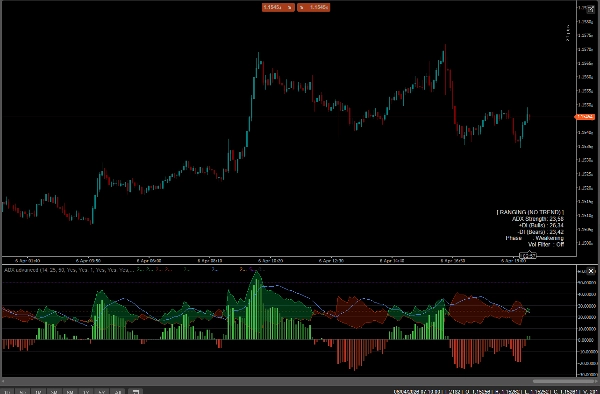
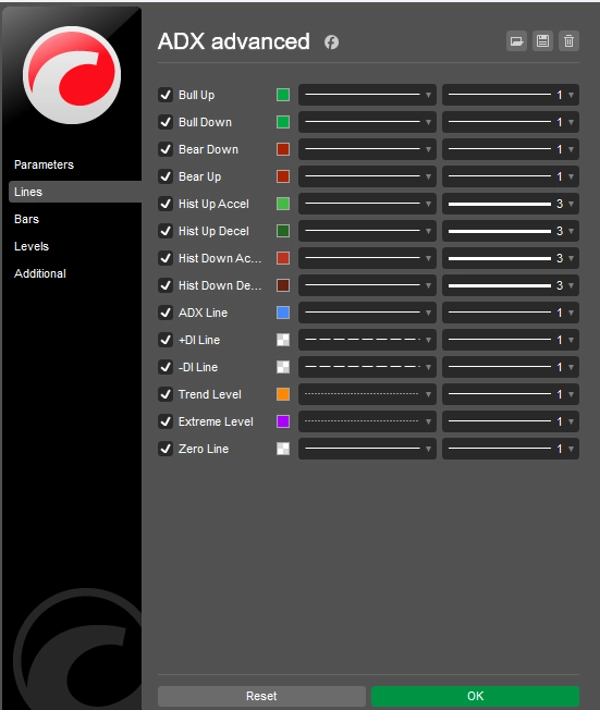
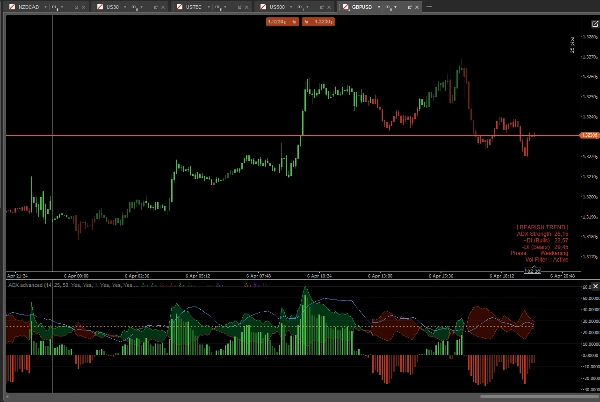
- Đám Mây Hướng (Đám Mây DI): Thay vì các đường giao nhau, khoảng không giữa +DI và -DI được lấp đầy bằng một đám mây màu động. Đám Mây Xanh Lá = Bò kiểm soát. Đám Mây Đỏ = Gấu kiểm soát.
- Biểu Đồ Đà Tiến: Một biểu đồ được xây dựng riêng ở dưới cùng của chỉ báo đo khoảng cách chính xác giữa +DI và -DI. Nó có các màu tăng tốc/giảm tốc, cho phép bạn phát hiện đà suy yếu trước khi xu hướng thực sự đảo chiều.
- Tô Màu Thanh Thông Minh (Paintbars): Chỉ báo trực tiếp tô màu nến giá của bạn dựa trên sức mạnh xu hướng!
-
- Xanh Lá Sáng/Đỏ Sáng: Xu Hướng Mạnh (ADX > 25 & +DI/-DI đồng thuận)
- Xanh Lá Đậm/Đỏ Đậm: Xu Hướng Yếu / Dao Động (ADX < 25)
- Tím/Hồng Đậm: Xu Hướng Quá Mức Căng Thẳng (ADX > 50) - Hãy chuẩn bị cho một đợt điều chỉnh!
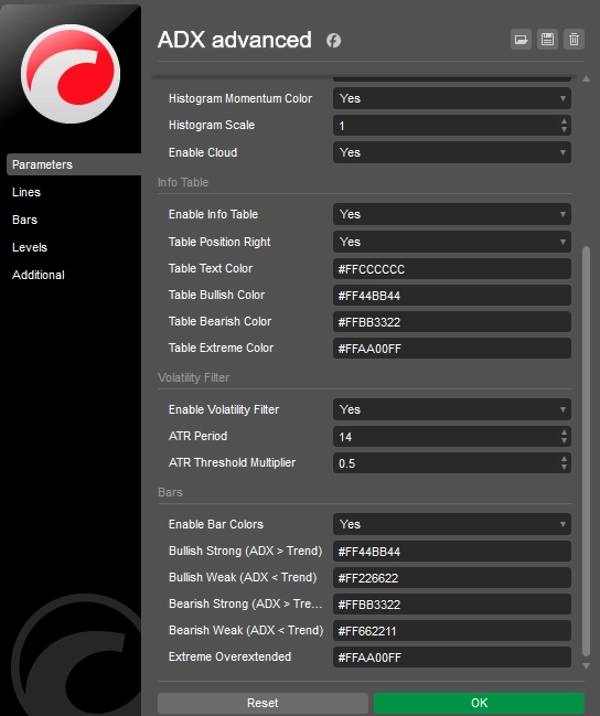
- Bảng Thông Tin Trên Biểu Đồ: Một bảng điều khiển thanh lịch, không gây phiền nhiễu hiển thị trạng thái thị trường hiện tại (Xu hướng, Dao động, Cực đoan), Sức Mạnh ADX và Giai Đoạn Đà Tiến theo thời gian thực.
- Bộ Lọc Biến Động Tích Hợp (ATR): Bộ lọc ATR tùy chọn làm mờ nến và thanh biểu đồ khi thị trường hoàn toàn phẳng, giúp bạn tránh giao dịch trong vùng dao động mạnh.
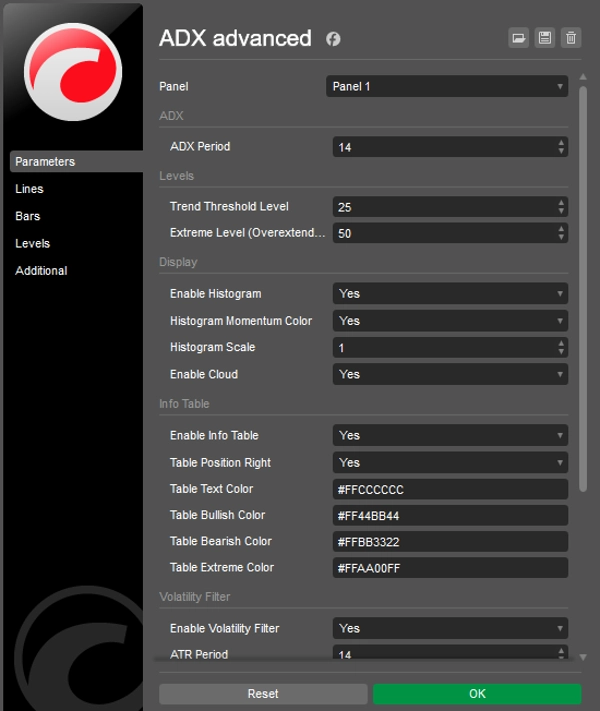
- Hoàn Toàn Tùy Biến: Thay đổi màu sắc, ngưỡng (Mức xu hướng 25, Mức cực đoan 50) và tỷ lệ biểu đồ để phù hợp với phong cách giao dịch cá nhân và chủ đề biểu đồ của bạn.
Cách sử dụng?
- Chờ đường ADX màu xanh dương vượt qua ngưỡng 25 (Xu hướng đang hoạt động).
- Nhìn vào Đám Mây và Biểu Đồ để xác nhận hướng đi (Xanh cho Mua, Đỏ cho Bán).
- Giao dịch các đột phá và theo xu hướng khi nến được tô màu "Mạnh".
- Chốt lời hoặc theo dõi điểm dừng khi đường ADX vượt qua mức Cực đoan 50 (nến chuyển sang màu tím).
Tóm tắt
Hồ sơ chỉ báo
Đánh giá của khách hàng
4.3
Đánh giá: 3
5 | 33 % | |
4 | 67 % | |
3 | 0 % | |
2 | 0 % | |
1 | 0 % |
Đánh giá của khách hàng
April 16, 2026
April 12, 2026
Thảo luận
Câu hỏi thường gặp
BTCUSD
Forex
Signal
Indices
EURUSD
Commodities
GBPUSD
NZDUSD
Prop
XAUUSD
NAS100
ATR
USDJPY
Các sản phẩm có sẵn trên cTrader Store, bao gồm bot giao dịch, chỉ báo và plugin, được cung cấp bởi các nhà phát triển bên thứ ba và chỉ nhằm mục đích cung cấp thông tin và tiếp cận kỹ thuật. cTrader Store không phải là nhà môi giới và không cung cấp lời khuyên đầu tư, khuyến nghị cá nhân hay bất kỳ đảm bảo nào về hiệu suất trong tương lai.


Giá
24
Lượt bán
677
Cài đặt miễn phí