
Mô tả
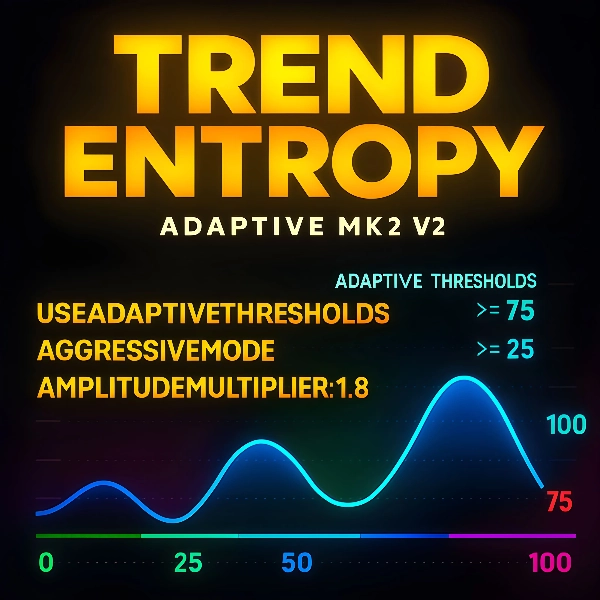
Trend Entropy – Chỉ báo cTrader miễn phí
Entropy là thước đo khoa học về sự rối loạn hoặc không chắc chắn trong một hệ thống. Trong vật lý, nó cho thấy cách năng lượng phân tán và tại sao các hệ thống di chuyển về phía hỗn loạn. Trong lý thuyết thông tin, nó đo độ không thể đoán trước trong dữ liệu. Entropy thấp có nghĩa là trật tự và khả năng dự đoán, trong khi entropy cao phản ánh sự ngẫu nhiên, phức tạp và giảm độ rõ ràng của kết quả.
Khám phá sức mạnh của trật tự trong hỗn loạn. Trend Entropy là một chỉ báo kỹ thuật tiên tiến được thiết kế để đo lường sự tổ chức so với sự ngẫu nhiên của các chuyển động giá. Khác với các bộ dao động truyền thống chỉ theo dõi động lượng hoặc biến động, Trend Entropy áp dụng các phép tính entropy nâng cao để tiết lộ liệu thị trường đang có xu hướng theo cách có cấu trúc hay trôi dạt vào hành vi dao động hỗn loạn.
Công cụ miễn phí này được xây dựng cho các nhà giao dịch muốn có cái nhìn sâu sắc hơn về động lực ẩn của hành động giá. Bằng cách kết hợp entropy thống kê với làm mượt kiểu RSI và ngưỡng thích ứng, Trend Entropy biến biến động thô thành một thang đo rõ ràng, chuẩn hóa từ 0% đến 100%. Kết quả là một đường duy nhất, thanh lịch cho bạn biết liệu thị trường đang trong xu hướng mạnh, hợp nhất trung tính hay phạm vi biến động.
Cách đọc Trend Entropy
Giá trị thấp (0–33%): Thị trường có tổ chức. Nếu lợi nhuận trung bình là dương, điều đó cho thấy xu hướng tăng có khả năng xảy ra. Nếu âm, nó báo hiệu xu hướng giảm có khả năng xảy ra.
Giá trị trung bình (34–66%): Vùng trung lập. Thị trường có thể đang hợp nhất, với xu hướng nhẹ về tăng hoặc giảm tùy thuộc vào lợi nhuận trung bình.
Giá trị cao (67–100%): Hỗn loạn chiếm ưu thế. Hành động giá đang dao động, không thể đoán trước và ít đáng tin cậy cho các chiến lược theo xu hướng.
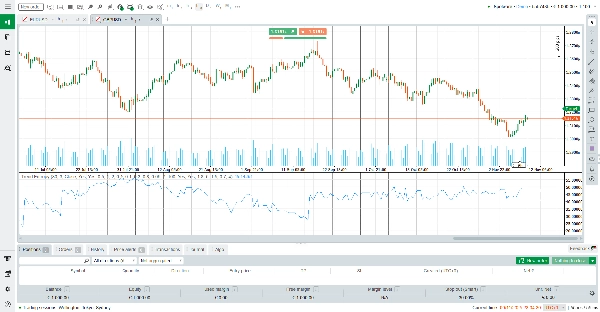
Các đường tham chiếu ngang tại 25%, 50% và 75% giúp việc giải thích trở nên đơn giản. Các nhà giao dịch có thể ngay lập tức thấy liệu entropy đang nén về phía trật tự hay mở rộng về phía hỗn loạn.
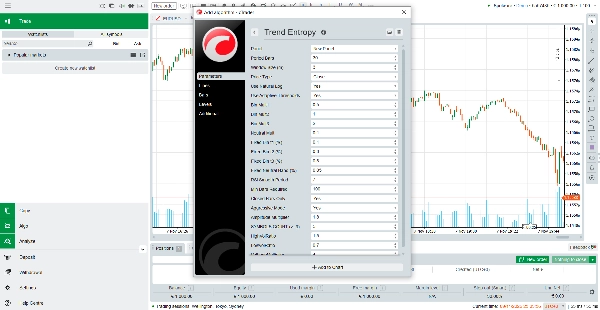
Cách hoạt động của chỉ báo
Trend Entropy tính toán lợi nhuận trong một khoảng thời gian đã chọn và ánh xạ chúng thành các trạng thái biểu tượng. Các trạng thái này được phân tích trong các cửa sổ chồng lấp để xây dựng phân phối tần suất các mẫu giá. Sử dụng toán học entropy, chỉ báo đo mức độ rối loạn trong các chuỗi này.
Để làm cho kết quả đầu ra thực tế, entropy thô được chuẩn hóa thành thang phần trăm và sau đó được làm mượt bằng phương pháp trung bình kiểu Wilder. Ngưỡng thích ứng đảm bảo chỉ báo điều chỉnh theo biến động hiện tại, trong khi chế độ mạnh mẽ khuếch đại tín hiệu cho các nhà giao dịch thích phản ứng sắc nét hơn. Cuối cùng, tỷ lệ biến động được áp dụng để tinh chỉnh kết quả đọc, đẩy giá trị cao hơn trong điều kiện hỗn loạn và thấp hơn trong điều kiện ổn định.
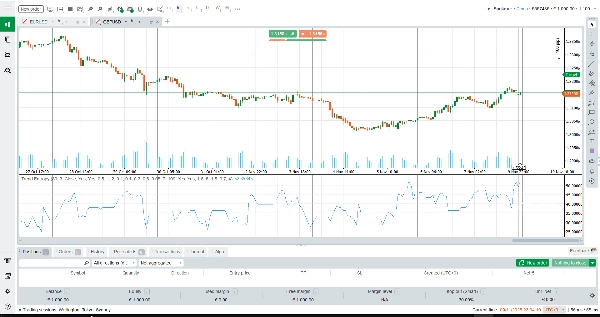
Kết quả cuối cùng là một đường duy nhất được làm mượt, nắm bắt bản chất của cấu trúc thị trường: liệu giá đang theo xu hướng có trật tự hay trôi dạt vào sự ngẫu nhiên.
Các tính năng chính
Phân tích dựa trên entropy – Vượt ra ngoài động lượng để đo lường sự tổ chức thực sự của hành động giá.
Ngưỡng thích ứng – Tự động điều chỉnh theo biến động, giữ cho tín hiệu luôn phù hợp trong mọi điều kiện thị trường.
Làm mượt kiểu RSI – Cung cấp một đường sạch, ổn định tránh dao động ồn ào.
Tích hợp biến động – Nâng cao độ chính xác bằng cách so sánh tỷ lệ biến động ngắn hạn và dài hạn.
Thiết kế trực quan rõ ràng – Các mức tham chiếu ngang và một đường DodgerBlue duy nhất giúp việc giải thích trở nên dễ dàng.
Tại sao chọn Trend Entropy?
Trend Entropy không chỉ là một bộ dao động khác. Nó là một công cụ lai kết hợp sự nghiêm ngặt thống kê với hình ảnh thân thiện với nhà giao dịch. Dù bạn là người theo xu hướng tìm kiếm sự xác nhận, hay nhà giao dịch phạm vi muốn tránh thị trường hỗn loạn, chỉ báo này mang đến cho bạn sự rõ ràng cần thiết.
Tóm tắt
The indicator outputs a single smoothed line on a normalized scale from 0% to 100%, where low values (0–33%) indicate organized trending markets, mid values (34–66%) suggest neutral or consolidating conditions, and high values (67–100%) reflect chaotic, ranging markets. Horizontal reference lines at 25%, 50%, and 75% aid interpretation.
Trend Entropy pro incorporates RSI-style smoothing, adaptive thresholds that adjust to current volatility, and volatility ratio integration to enhance signal accuracy. It is designed to provide traders with deeper insight into market dynamics beyond traditional momentum or volatility indicators, supporting analysis across various markets including Forex, cryptocurrencies, commodities, indices, and stocks.
This indicator is suitable for traders seeking to identify trending versus ranging conditions and improve decision-making in trend-following or range-trading strategies.


