
Mô tả
✅ UATKit được cung cấp miễn phí như một đóng góp thiện chí cho cộng đồng cTrader, được tạo ra bởi một nhà giao dịch chuyên nghiệp hiểu được những thách thức hàng ngày của việc phân tích biểu đồ và thực thi.
⚠️Vui lòng kiểm tra trang sản phẩm định kỳ để cập nhật, vì cTrader không thông báo cho người dùng khi các phiên bản mới của chỉ báo được phát hành.
⭐️ Tôi cũng rất vui khi nhận được nhận xét và phản hồi của bạn trong Đánh giá Khách hàng và Phần Thảo luận.
1. Sản phẩm này là gì
Một bộ công cụ cải thiện quy trình làm việc toàn diện được thiết kế để làm cho việc biểu đồ trên cTrader trở nên mượt mà hơn, rõ ràng hơn và hiệu quả hơn.
Universal Assistant Toolkit (UATKit) là một công cụ đồng hành đa tính năng bên cạnh biểu đồ cho cTrader.
Nó kết hợp nhiều công cụ thực tế - mỗi công cụ được thiết kế để giải quyết một nhu cầu quy trình làm việc cụ thể - vào một chỉ báo thống nhất, nhẹ.
Mỗi tính năng trong UATKit đều có thể tùy chỉnh hoàn toàn và hoạt động độc lập, cho phép nhà giao dịch kiểm soát hoàn toàn để điều chỉnh hành vi, hình ảnh và phím nóng trong khi chỉ kích hoạt các công cụ họ cần để có trải nghiệm biểu đồ sạch sẽ, phản hồi nhanh.
UATKit được cung cấp miễn phí như một đóng góp thiện chí cho cộng đồng cTrader, được tạo ra bởi một nhà giao dịch chuyên nghiệp hiểu được những thách thức hàng ngày của việc phân tích biểu đồ và thực thi.
2. Bộ công cụ này dành cho ai
UATKit được xây dựng cho các nhà giao dịch:
- Dành nhiều thời gian phân tích biểu đồ
- Ưa thích bố cục biểu đồ sạch sẽ, thông tin và có thể tùy chỉnh
- Muốn truy cập nhanh hơn vào các hành động phổ biến thông qua phím nóng
- Cần sự rõ ràng về mặt hình ảnh trong các thị trường di chuyển nhanh
- Đánh giá cao các công cụ nâng cao quy trình làm việc mà không làm tăng sự lộn xộn
Dù bạn giao dịch lướt sóng, giao dịch dao động hay chỉ đơn giản muốn một môi trường biểu đồ có tổ chức hơn, UATKit sẽ thích ứng với phong cách của bạn.
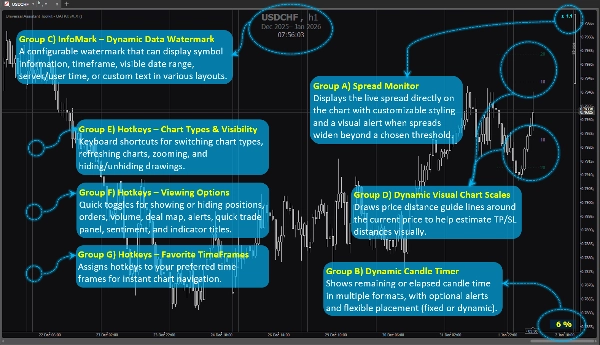
3. Tổng quan các nhóm tính năng
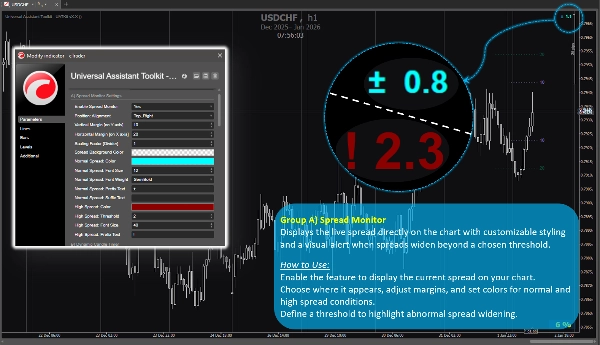
Nhóm Tính năng A) 🔸 Giám sát Spread
Hiển thị spread trực tiếp trên biểu đồ với kiểu dáng có thể tùy chỉnh và cảnh báo hình ảnh khi spread mở rộng vượt quá ngưỡng đã chọn.
Cách sử dụng:
Bật tính năng để hiển thị spread hiện tại trên biểu đồ của bạn.
Chọn vị trí hiển thị, điều chỉnh lề và đặt màu cho điều kiện spread bình thường và cao.
Đặt ngưỡng để làm nổi bật sự mở rộng spread bất thường.
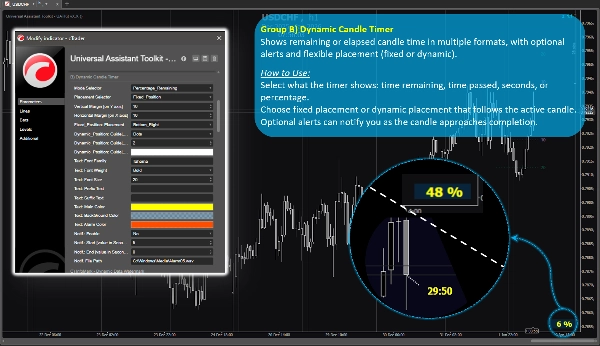
Nhóm Tính năng B) 🔸 Bộ đếm thời gian Nến động
Hiển thị thời gian còn lại hoặc đã trôi qua của nến theo nhiều định dạng, với cảnh báo tùy chọn và vị trí linh hoạt (cố định hoặc động).
Cách sử dụng:
Chọn những gì bộ đếm hiển thị: thời gian còn lại, thời gian đã qua, giây hoặc phần trăm.
Chọn vị trí cố định hoặc vị trí động theo nến đang hoạt động.
Cảnh báo tùy chọn có thể thông báo khi nến gần kết thúc.
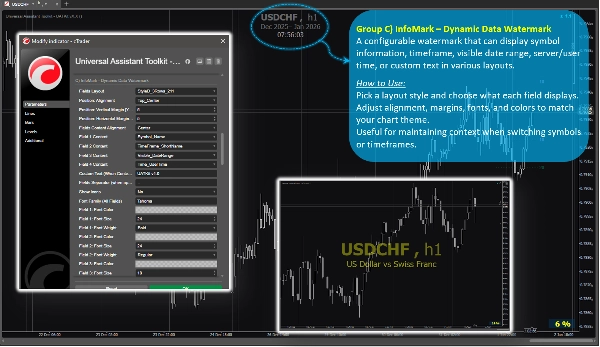
Nhóm Tính năng C) 🔸 InfoMark – Dấu Nước Dữ Liệu Động
Một dấu nước có thể cấu hình hiển thị thông tin ký hiệu, khung thời gian, phạm vi ngày hiển thị, thời gian máy chủ/người dùng hoặc văn bản tùy chỉnh theo nhiều bố cục khác nhau.
Cách sử dụng:
Chọn kiểu bố cục và chọn nội dung hiển thị cho từng trường.
Điều chỉnh căn chỉnh, lề, phông chữ và màu sắc để phù hợp với chủ đề biểu đồ của bạn.
Hữu ích để duy trì ngữ cảnh khi chuyển đổi ký hiệu hoặc khung thời gian.
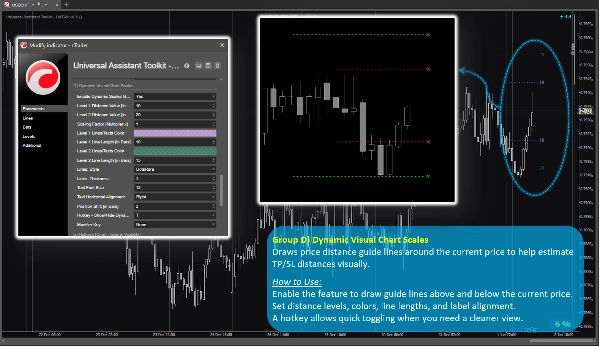
Nhóm Tính năng D) 🔸 Thang đo Biểu đồ Hình ảnh Động
Vẽ các đường hướng dẫn khoảng cách giá quanh giá hiện tại để giúp ước lượng khoảng cách TP/SL một cách trực quan.
Cách sử dụng:
Bật tính năng để vẽ các đường hướng dẫn phía trên và dưới giá hiện tại.
Đặt mức khoảng cách, màu sắc, độ dài đường và căn chỉnh nhãn.
Phím nóng cho phép chuyển đổi nhanh khi bạn cần một cái nhìn sạch hơn.
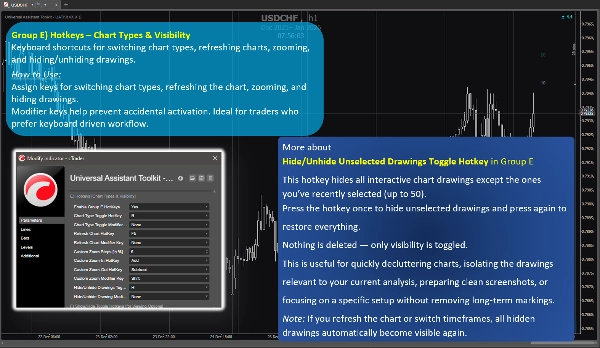
Nhóm Tính năng E) 🔸 Phím nóng – Loại Biểu đồ & Hiển thị
Phím tắt bàn phím để chuyển đổi loại biểu đồ, làm mới biểu đồ, phóng to và ẩn/hiện các bản vẽ.
Cách sử dụng:
Gán phím để chuyển đổi loại biểu đồ, làm mới biểu đồ, phóng to và ẩn các bản vẽ.
Phím điều chỉnh giúp ngăn chặn kích hoạt nhầm. Lý tưởng cho các nhà giao dịch thích quy trình làm việc bằng bàn phím.
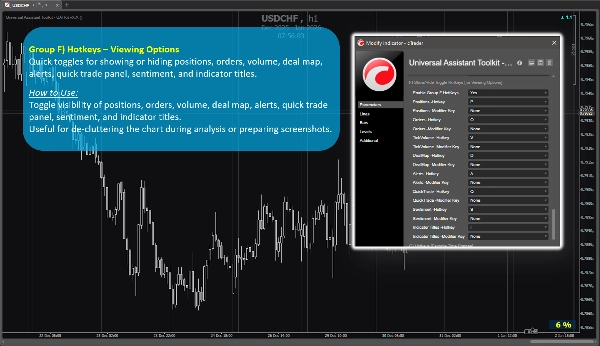
Nhóm Tính năng F) 🔸 Phím nóng – Tùy chọn Hiển thị
Chuyển đổi nhanh để hiển thị hoặc ẩn vị trí, lệnh, khối lượng, bản đồ giao dịch, cảnh báo, bảng giao dịch nhanh, tâm lý và tiêu đề chỉ báo.
Cách sử dụng:
Chuyển đổi hiển thị vị trí, lệnh, khối lượng, bản đồ giao dịch, cảnh báo, bảng giao dịch nhanh, tâm lý và tiêu đề chỉ báo.
Hữu ích để giảm bớt sự lộn xộn trên biểu đồ khi phân tích hoặc chuẩn bị ảnh chụp màn hình.
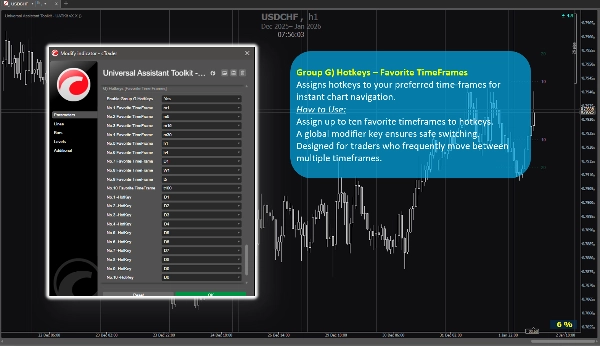
Nhóm Tính năng G) 🔸 Phím nóng – Khung Thời gian Yêu thích
Gán phím nóng cho các khung thời gian ưa thích của bạn để điều hướng biểu đồ ngay lập tức.
Cách sử dụng:
Gán tối đa mười khung thời gian yêu thích cho phím nóng.
Phím điều chỉnh toàn cục đảm bảo chuyển đổi an toàn.
Được thiết kế cho các nhà giao dịch thường xuyên chuyển giữa nhiều khung thời gian.
4. Ghi chú bổ sung cho người dùng
- Tất cả các tính năng đều tùy chọn và có thể được bật hoặc tắt riêng lẻ.
- Bộ công cụ được tối ưu hóa cho hiệu suất và thiết kế để không gây ảnh hưởng đến các chỉ báo khác.
- Hầu hết các tham số đều có chú giải công cụ tích hợp sẵn. Chỉ cần di chuột qua bất kỳ cài đặt nào để xem hướng dẫn và ghi chú sử dụng thêm.
- Không sử dụng nguồn dữ liệu bên ngoài; tất cả thông tin đều đến từ biểu đồ và nền tảng.
- Bộ công cụ này được cung cấp miễn phí để hỗ trợ cộng đồng cTrader và cải thiện quy trình làm việc biểu đồ hàng ngày.
- Cài đặt mặc định hợp lý, vì vậy người dùng không cần cấu hình đặc biệt có thể dựa vào các tham số được thiết lập sẵn mà không tốn thêm thời gian thiết lập.
- ⭐️ Phản hồi và đề xuất được hoan nghênh để giúp hoàn thiện các phiên bản tương lai (sử dụng phần thảo luận trên trang này).
- ⚠️Vui lòng kiểm tra trang sản phẩm định kỳ để cập nhật, vì cTrader không thông báo cho người dùng khi các phiên bản mới của chỉ báo được phát hành.
Tóm tắt
Key features include:
- **Spread Monitor:** Displays live spread on the chart with customizable visuals and alerts for spread widening.
- **Dynamic Candle Timer:** Shows remaining or elapsed candle time in various formats, with optional alerts and flexible positioning.
- **InfoMark Watermark:** Configurable watermark displaying symbol info, timeframe, date range, server/user time, or custom text.
- **Dynamic Visual Chart Scales:** Price-distance guide lines around current price to estimate take-profit/stop-loss distances visually.
- **Hotkeys for Chart Types & Visibility:** Keyboard shortcuts for switching chart types, refreshing, zooming, and toggling drawing visibility.
- **Hotkeys for Viewing Options:** Quick toggles for positions, orders, volume, deal map, alerts, quick trade panel, sentiment, and indicator titles.
- **Hotkeys for Favorite TimeFrames:** Assign up to ten favorite timeframes to hotkeys for instant navigation.
All features are optional and configurable, optimized for performance without interfering with other indicators. UATKit supports various markets including Forex, indices, commodities, crypto, and stocks. It is intended for traders who seek a clean, customizable, and efficient charting environment with enhanced workflow controls.
Đánh giá của khách hàng
5 | 100 % | |
4 | 0 % | |
3 | 0 % | |
2 | 0 % | |
1 | 0 % |


