Description
Le problème : surcharge d'informations
La plupart des traders échouent parce que leurs graphiques sont encombrés d'indicateurs retardés et de trop nombreuses lignes. Ils perdent de vue l'essentiel : la structure du marché.
La solution : structure de biais de tendance
Cet indicateur est une solution "Deux-en-Un" puissante pour la plateforme cTrader. Il combine une détection de swing professionnelle avec un moteur de notation objectif qui vous indique exactement qui contrôle le marché.
Caractéristiques clés :
- Cartographie intelligente de la structure : Identifie automatiquement les niveaux significatifs de support et de résistance en utilisant la volatilité filtrée par ATR.
- Le moteur de notation SGE : Un système de notation unique (-2, 0, +2) qui calcule la force de la tendance en fonction du nombre de niveaux structurels franchis.
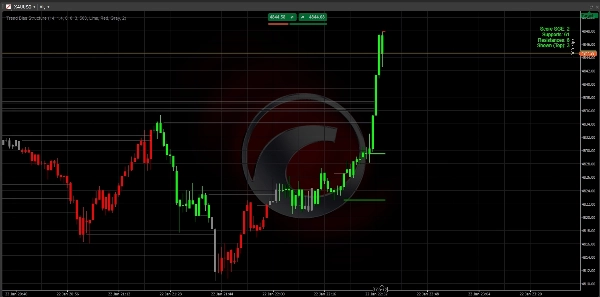
- Technologie anti-encombrement : Affiche uniquement les 3 niveaux pertinents les plus proches du prix actuel. Votre graphique reste propre, professionnel et exploitable.
- Détection de momentum : Utilise la logique de la "grosse bougie" pour s'assurer que vous ne tradez que des mouvements soutenus par de véritables institutions.
- Entièrement personnalisable : Adaptez la sensibilité à votre actif spécifique (XAUUSD, Forex ou indices).
Comment trader avec :
- Vérifiez le score : Cherchez +2 (haussier) ou -2 (baissier).
- Attendez le repli : Laissez le prix revenir vers l'une des lignes de structure tracées.
- Exécutez : Tradez avec le biais, en utilisant les niveaux comme points d'entrée/sortie.
Spécifications techniques
- Plateforme : cTrader
- Langage : C# (.NET)
- Unités de temps : Fonctionne sur toutes les unités de temps (M1 à mensuel).
- Actifs : Optimisé pour les paires à forte liquidité (XAUUSD, EURUSD, GBPUSD).
Note : Paramètres initiaux : Pour la plupart des paires majeures, les paramètres par défaut sont optimisés. Si vous tradez des indices volatils, vous pouvez augmenter le Range Global ATR Mult à 2.0
Important : lecture du tableau de bord
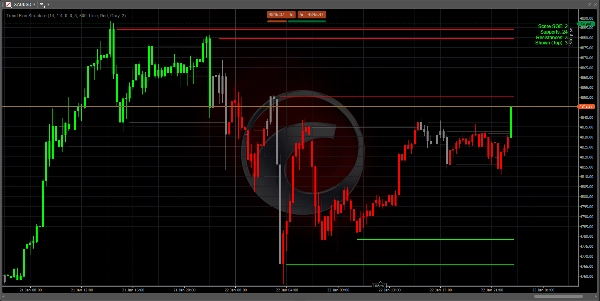
Le tableau de bord en haut à droite est votre centre de commande :
- Score +2 (vert) : Fortement haussier. Ne cherchez que des configurations d'achat.
- Score -2 (rouge) : Fortement baissier. Ne cherchez que des configurations de vente.
- Score 0 (gris) : Neutre. Le marché est en range ou en transition. Restez patient.
- Supports/Résistances : Montre combien de "planchers" et "plafonds" historiques existent dans la tendance actuelle.
Stratégie d'entrée en 3 étapes
Étape 1 : Identifier le biais Attendez que les couleurs des bougies et le score du tableau de bord atteignent +2 ou -2. Cela confirme que le marché a cassé la structure et qu'une tendance démarre.
Étape 2 : La zone de valeur Ne courez pas après le prix. Attendez que le prix fasse un repli (retracement) vers l'une des 3 lignes les plus proches tracées sur votre graphique.
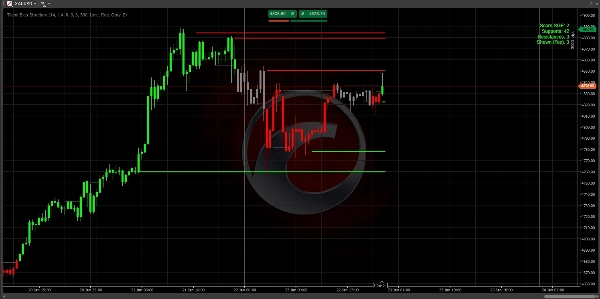
- Dans une tendance baissière (score -2), attendez que le prix touche une ligne rouge.
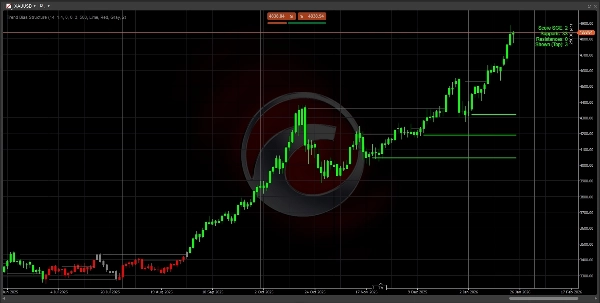
- Dans une tendance haussière (score +2), attendez que le prix touche une ligne verte.
Étape 3 : Exécution Entrez dans votre trade lorsque le prix touche la ligne et montre un rejet (formation d'une mèche).
- Stop Loss : Placez votre SL juste derrière la ligne structurelle.
- Take Profit : Visez la ligne structurelle suivante dans la direction de la tendance.
Conseils professionnels pour réussir
- Règle des unités de temps supérieures : Un score de +2 sur le H4 ou le D1 est bien plus puissant qu'un score sur le graphique M5. Utilisez l'unité de temps supérieure pour trouver le biais, et l'unité inférieure pour trouver votre entrée.
- Graphiques épurés : Si l'écran semble chargé, allez dans les paramètres et changez
Max Levels to Showà 2. Cela vous montrera uniquement les "planchers" et "plafonds" les plus critiques. - La zone "zéro" : Lorsque le score est 0, le marché est en "recalcul". C'est le meilleur moment pour prendre des profits sur les trades précédents et attendre une nouvelle cassure.
Dépannage
- Pas de lignes visibles ? Vérifiez si vous avez suffisamment d'historique chargé sur votre graphique. L'indicateur a besoin d'au moins 100-200 barres pour calculer l'ATR et les niveaux de swing.
- Retard de l'indicateur ? Si votre PC est lent, réduisez le paramètre
Max Historical Linesà 200 pour libérer la mémoire plus rapidement.
Foire aux questions (FAQ)
Q : Cet indicateur se repeint-il ?
R : Non. Les niveaux et scores sont calculés sur la base des clôtures de bougies confirmées. Une fois qu'un niveau est franchi ou qu'un score change à la clôture d'une bougie, il est figé dans l'historique.
Q : Quelle unité de temps est la meilleure ?
R : La logique est universelle. Cependant, la plupart des traders professionnels l'utilisent sur les graphiques H1, H4 ou Daily pour identifier la "structure institutionnelle". Si vous scalpez sur M1 ou M5, attendez-vous à des changements de score plus fréquents.
Q : Puis-je l'utiliser avec d'autres indicateurs ?
R : Oui ! Il fonctionne parfaitement comme un "filtre directionnel". Par exemple, ne prenez des signaux RSI survendus que si le score de biais de tendance est +2.
Bon trading !
Aucun conseil financier. L'indicateur Trend Bias Structure est un outil d'analyse technique conçu pour aider les traders à identifier la structure du marché et le biais de tendance.
Résumé
Key features include:
- Smart Structure Mapping: Automatically detects significant support and resistance levels filtered by ATR-based volatility.
- SGE Scoring Engine: Calculates trend strength by counting breached structural levels.
- Anti-Clutter Display: Shows only the three closest relevant levels to maintain chart clarity.
- Momentum Detection: Uses "Big Candle" logic to highlight moves with institutional backing.
- Customizable sensitivity for different assets such as XAUUSD, EURUSD, GBPUSD, and indices.
The indicator works on all timeframes from 1 minute to monthly, with professional traders typically using H1, H4, or daily charts to identify institutional structure. The dashboard provides a clear bias score and structural levels to guide trade entries and exits. Users are advised to trade with the bias, waiting for price pullbacks to the nearest structure lines before executing trades.
This tool is intended as a directional filter and can be combined with other indicators like RSI. It does not repaint, as calculations are based on confirmed candle closes.
Avis clients
5 | 100 % | |
4 | 0 % | |
3 | 0 % | |
2 | 0 % | |
1 | 0 % |