
STC
Chỉ báo
278 lượt tải
Phiên bản 1.0, Jan 2025
Windows, Mac
5.0
Đánh giá: 2
Mô tả
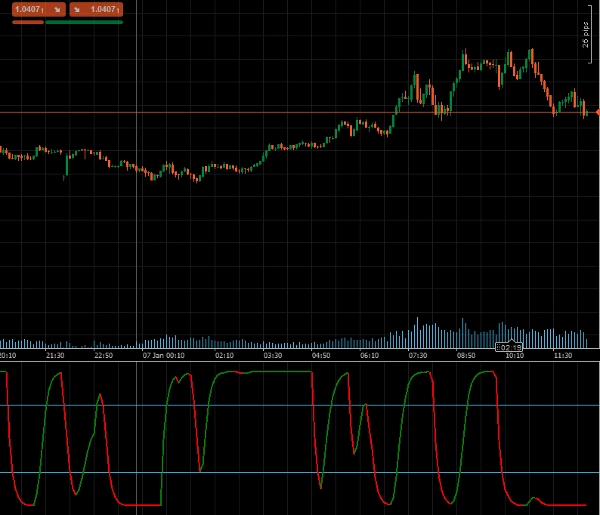
Schaff Trend Cycle (STC), được phát triển bởi nhà phân tích kỹ thuật nổi tiếng Doug Schaff, là một chỉ báo giao dịch tiên tiến được thiết kế để xác định xu hướng và sự đảo chiều của thị trường với tốc độ và độ chính xác vượt trội. Dựa trên ý tưởng sáng tạo kết hợp các thành phần xu hướng và chu kỳ, STC sử dụng trung bình động hàm mũ (EMA) và các phép tính ngẫu nhiên để khắc phục những hạn chế của các chỉ báo trễ như MACD hoặc Stochastic Oscillator. Phương pháp độc đáo này cung cấp các tín hiệu giao dịch sớm hơn và đáng tin cậy hơn, mang lại lợi thế đáng kể trong việc phát hiện xu hướng và phân tích thị trường.
Các tính năng chính:
- Phát hiện xu hướng sớm: Kết hợp trung bình động hàm mũ (EMA) với các phép tính ngẫu nhiên để bắt kịp xu hướng nhanh hơn.
- Cài đặt tùy chỉnh: Điều chỉnh độ dài, MA nhanh, MA chậm, loại MA và hệ số làm mượt để phù hợp với chiến lược giao dịch của bạn.
- Cảnh báo trực quan: Thay đổi màu sắc động cho biết xu hướng tăng hoặc giảm, giúp dễ dàng hiểu điều kiện thị trường.
- Hỗ trợ mức quá mua/quá bán: Các mức tích hợp (25 và 75) giúp xác định các điểm đảo chiều tiềm năng của thị trường.
Tham số
- Độ dài: Xác định số kỳ để tính xu hướng.
- Độ dài MA nhanh: Đặt độ dài của trung bình động nhanh.
- Độ dài MA chậm: Chỉ định độ dài của trung bình động chậm.
- Loại MA: Cho phép chọn loại trung bình động (ví dụ: EMA, SMA).
- Hệ số làm mượt: Điều chỉnh hệ số làm mượt để có tín hiệu xu hướng tinh tế hơn.
Đầu ra
- STC: Xuất giá trị chính của Schaff Trend Cycle, đại diện cho hướng và sức mạnh xu hướng, để sử dụng lập trình trong các hệ thống giao dịch tự động.
- STCBull: Làm nổi bật các điều kiện xu hướng tăng.
- STCBear: Làm nổi bật các điều kiện xu hướng giảm.
Tóm tắt
Hồ sơ chỉ báo
Đánh giá của khách hàng
5.0
Đánh giá: 2
5 | 100 % | |
4 | 0 % | |
3 | 0 % | |
2 | 0 % | |
1 | 0 % |
Đánh giá của khách hàng
August 12, 2025
Pros: Fast and accurate trend detection, earlier signals than MACD, customizable levels. Cons: No alerts, no MTF mode, no trade statistics.
Thảo luận
Câu hỏi thường gặp
MACD
Các sản phẩm có sẵn trên cTrader Store, bao gồm bot giao dịch, chỉ báo và plugin, được cung cấp bởi các nhà phát triển bên thứ ba và chỉ nhằm mục đích cung cấp thông tin và tiếp cận kỹ thuật. cTrader Store không phải là nhà môi giới và không cung cấp lời khuyên đầu tư, khuyến nghị cá nhân hay bất kỳ đảm bảo nào về hiệu suất trong tương lai.
Sản phẩm khác của tác giả này


Giá
Kể từ 24/09/2024
4.47K
Cài đặt miễn phí