
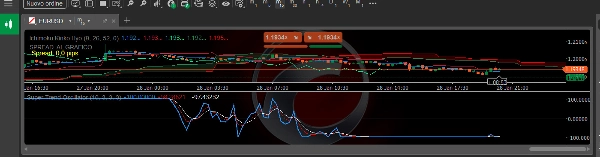
Super Trend Oscillator
インジケーター
バージョン 1.0、Jan 2026
Windows、Mac
5.0
レビュー: 2
説明
スーパー・トレンド・オシレーター
スーパー・トレンド・オシレーター – cTraderインジケーター
説明
スーパー・トレンド・オシレーターは、cTrader向けに設計された独自のモメンタムおよびトレンド強度インジケーターで、クラシックなスーパー・トレンドの概念を滑らかで中心化されたオシレーターに変換することを目的としています。
ATRベースのスーパー・トレンドロジックと多段階EMA平滑化を組み合わせることで、このインジケーターは市場の方向性、モメンタムの加速、およびトレンドの質を明確に示し、M1などの低時間足でのスキャルピングや短期取引に最適です。
従来のトレンドインジケーターとは異なり、スーパー・トレンド・オシレーターはゼロラインの周りで振動し、トレーダーが強気および弱気の圧力、モメンタムの変化、潜在的なトレンドの継続または減速を簡単に識別できるようにします。
動作原理
- 動的な市場方向を定義するためにATRベースのスーパー・トレンド計算を使用します。
- 価格とスーパー・トレンド間の距離を正規化されたオシレーターに変換します。
- 価格変動に対する迅速な反応を維持しつつノイズを減らすために二重EMA平滑化を適用します。
- 値は0を中心に配置され、一貫した視覚的解釈のために制御された範囲を持ちます。
主な特徴
- 📊 中心化オシレーター(±100の範囲)
明確な強気/弱気のモメンタムの視覚化。 - ⚡ 高速かつ応答性に優れる
低時間足および高頻度市場条件に最適化。 - 🧠 トレンド+モメンタムのハイブリッド
単一のインジケーターでトレンド方向とモメンタム強度を組み合わせ。 - 🎯 マルチライン構造
メインのオシレーターラインに加え、シグナルおよびスロースムージングラインで確認。 - 🔄 非再描画
クローズドバーの計算のみを使用。
取引用途
- M1〜M5時間足でのトレンド確認
- 自動取引システム(cBots)向けのモメンタムフィルター
- スキャルピングおよび日中取引戦略
- エントリータイミングとトレンド強度の検証
併用に最適
- EMAベースのトレンド戦略
- プライスアクションおよびブレイクアウトシステム
- モメンタムフィルターを必要とする自動取引ボット
免責事項
このインジケーターはテクニカル分析ツールであり、利益を保証するものではありません。常にご自身の取引スタイルとリスク管理ルールに従ってテストおよび最適化を行ってください。
概要
インジケーターのプロフィール
カスタマーレビュー
5.0
レビュー: 2
5 | 100 % | |
4 | 0 % | |
3 | 0 % | |
2 | 0 % | |
1 | 0 % |
カスタマーレビュー
February 10, 2026
a 5 minute check should not become a 30 minute rabbit hole. The trade idea gets a short cooling period.
February 2, 2026
ディスカッション
よくあるご質問
Prop
Forex
Indices
Commodities
Crypto
Stocks
cTrader Storeで入手可能な取引ボット、インジケーター、プラグインなどの商品は、第三者の開発者が提供するものであり、情報と技術の取得のみを目的としてご利用いただけます。cTrader Storeはブローカーではなく、投資助言や個人的な推奨を行うことも、将来のパフォーマンスを保証することもありません。
この作成者の他の商品


価格
12
販売
1.47K
無料インストール