
Mô tả
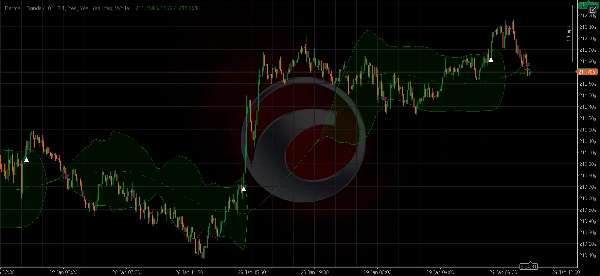
Bermaui Bands (BB) là một công cụ phân tích kỹ thuật giúp lọc giữa các chuyển động giá trong phạm vi và xu hướng. Ý tưởng đằng sau chỉ báo này có thể được giải thích qua các bước sau -
- Tính Độ lệch chuẩn như một bộ dao động di chuyển giữa 0 và 100. Gọi nó là phần trăm Độ lệch Bermaui (BD percent).
- Nếu "BD percent" gần bằng không thì biến động đang ở mức cực đoan. Ngoài ra, nếu "BD percent" gần 100 thì biến động rất thấp.
- Biến động cao có nghĩa là khả năng cao cho một thị trường có xu hướng, trong khi biến động thấp có nghĩa là thị trường đi ngang hoặc trong phạm vi.
- Đường giữa là Đường Trung Bình Đơn giản vì Độ lệch chuẩn được tính dựa trên Đường Trung Bình.
- Cộng "BD percent" vào đường trung bình đơn giản với cùng số thanh trong phép tính để có Đường Bermaui Trên.
- Trừ "BD percent" khỏi đường trung bình đơn giản với cùng số thanh trong phép tính để có Đường Bermaui Dưới.
Tóm tắt
Hồ sơ chỉ báo
Đánh giá của khách hàng
0.0
Đánh giá: 0
Đánh giá của khách hàng
Sản phẩm này chưa có đánh giá nào. Bạn đã dùng thử chưa? Hãy là người đầu tiên chia sẻ với mọi người!
Thảo luận
Câu hỏi thường gặp
Forex
Signal
Breakout
Indices
Commodities
Crypto
Stocks
Các sản phẩm có sẵn trên cTrader Store, bao gồm bot giao dịch, chỉ báo và plugin, được cung cấp bởi các nhà phát triển bên thứ ba và chỉ nhằm mục đích cung cấp thông tin và tiếp cận kỹ thuật. cTrader Store không phải là nhà môi giới và không cung cấp lời khuyên đầu tư, khuyến nghị cá nhân hay bất kỳ đảm bảo nào về hiệu suất trong tương lai.


Giá
Kể từ 28/01/2026