Mô tả
Chỉ báo Dấu chân Chuyên nghiệp & Delta cho cTrader
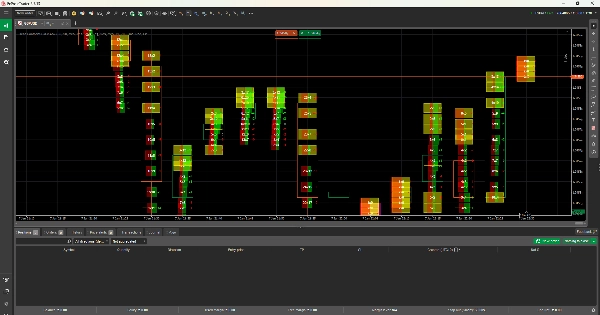
Chỉ báo Dấu chân này cho cTrader đọc dữ liệu tick thực để hiển thị cách người mua và người bán tương tác ở mỗi mức giá. Nó hiển thị khối lượng, delta mua/bán và sự mất cân bằng, giúp các nhà giao dịch nhìn rõ ai đang kiểm soát thị trường.
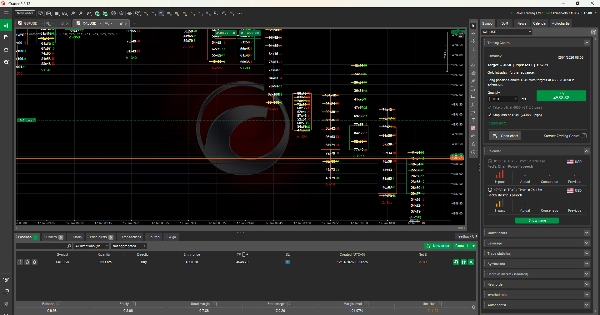
Được xây dựng dựa trên khái niệm Hồ sơ Thị trường và Hồ sơ Khối lượng, chỉ báo làm nổi bật các khu vực hoạt động cao, vùng giá trị và hỗ trợ hoặc kháng cự mạnh. Thay vì đoán dựa trên giá, các nhà giao dịch có thể đưa ra quyết định dựa trên khối lượng giao dịch thực và dòng lệnh.
Hoàn hảo cho giao dịch lướt sóng và trong ngày, công cụ này mang lại lợi thế chuyên nghiệp cho người dùng cTrader bằng cách tiết lộ câu chuyện thực sự đằng sau biến động giá.
Chỉ báo này giúp bạn hiểu những gì thực sự xảy ra bên trong mỗi cây nến. Nó đọc dữ liệu tick và hiển thị có bao nhiêu người mua và người bán đã giao dịch ở mỗi mức giá.
Bạn có thể thấy rõ:
- Nơi người mua mạnh hơn
- Nơi người bán mạnh hơn
- Khi động lượng đang tăng hoặc giảm
Chỉ báo cũng hiển thị delta, nghĩa là sự khác biệt giữa áp lực mua và bán. Nó được xây dựng dựa trên Hồ sơ Thị trường và Hồ sơ Khối lượng, vì vậy bạn có thể dễ dàng nhận biết các khu vực giá quan trọng nơi thị trường phản ứng.
Điều này giúp giao dịch dễ dàng hơn cho người mới bắt đầu vì bạn không phải đoán. Bạn có thể thấy khối lượng thực và hoạt động thị trường thực, không chỉ là các chỉ báo dựa trên giá.