
Mô tả
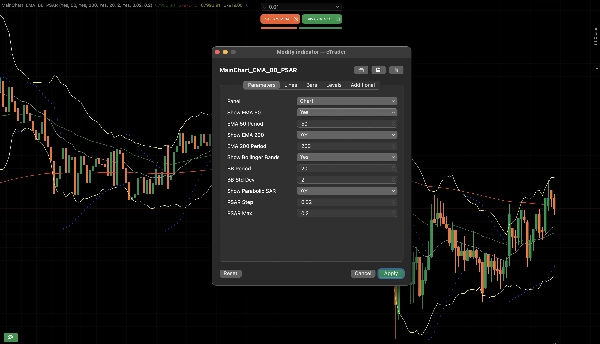
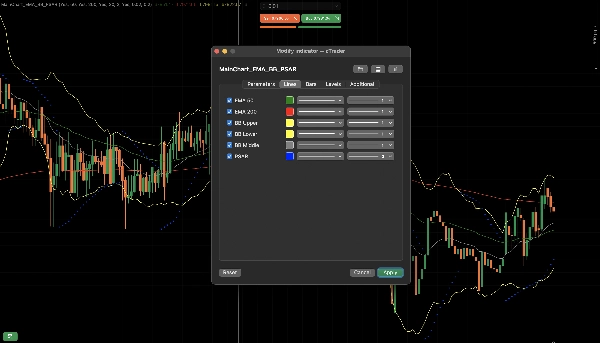
MainChart_EMA_BB_PSAR
Cách Hoạt Động
1. Khái Niệm Cốt Lõi
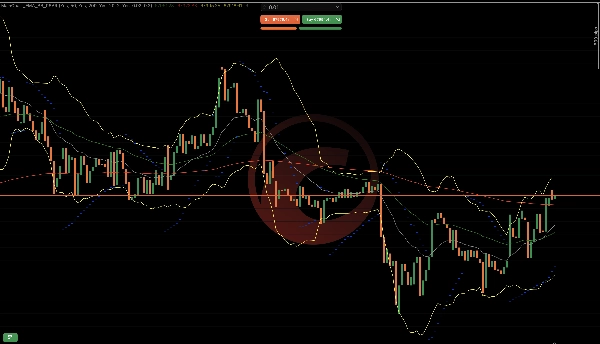
Chỉ báo này kết hợp logic xu hướng, biến động và tiếp tục động lượng thành một lớp phủ duy nhất:
EMA 50 & EMA 200 → Hướng xu hướng
Dải Bollinger → Biến động & sự mở rộng
Parabolic SAR → Tiếp tục xu hướng & thời điểm đảo chiều
Mỗi thành phần phục vụ một chức năng cụ thể. Cùng nhau, chúng tạo thành một khung quyết định có cấu trúc.
2. Logic EMA (Bộ Động Cơ Xu Hướng)
Nó Làm Gì
Tính trung bình hàm mũ của giá đóng cửa.
EMA 50 phản ứng nhanh hơn.
EMA 200 phản ứng chậm hơn.
Cách Nó Diễn Giải Thị Trường
Ý Nghĩa Điều Kiện
EMA 50 trên EMA 200 Xu hướng tăng
EMA 50 dưới EMA 200 Xu hướng giảm
EMA 50 cắt EMA 200 Có thể thay đổi xu hướng
Tại Sao Nó Hoạt Động
EMA làm mượt giá và lọc nhiễu.
Mối quan hệ 50/200 cho thấy động lượng ngắn hạn so với hướng dài hạn.
3. Logic Dải Bollinger (Bộ Động Cơ Biến Động)
Nó Làm Gì
Tính trung bình động (dải giữa)
Xây dựng dải trên/dưới sử dụng độ lệch chuẩn
Cách Nó Diễn Giải Thị Trường
Ý Nghĩa Điều Kiện
Dải thu hẹp Biến động thấp (nén)
Dải mở rộng Biến động cao (động thái mạnh đang hoạt động)
Giá chạm dải ngoài Có thể quá mức
Tại Sao Nó Hoạt Động
Thị trường luân phiên giữa nén và mở rộng.
Phá vỡ thường xảy ra sau khi biến động thu hẹp.
4. Logic Parabolic SAR (Bộ Động Cơ Tiếp Tục)
Nó Làm Gì
Vẽ các chấm trên hoặc dưới giá.
Tăng tốc khi xu hướng tiếp tục.
Cách Nó Diễn Giải Thị Trường
Ý Nghĩa Vị Trí Chấm
Dưới giá Xu hướng tăng đang hoạt động
Trên giá Xu hướng giảm đang hoạt động
Chấm đổi vị trí Có thể đảo chiều
Tại Sao Nó Hoạt Động
PSAR thu hẹp khi xu hướng trưởng thành, giúp theo dõi các động thái và phát hiện sự kiệt sức.
5. Cách Tất Cả Thành Phần Hoạt Động Cùng Nhau
Cấu trúc tăng
EMA 50 trên EMA 200
Giá trên EMA 50
PSAR dưới nến
Dải Bollinger mở rộng lên trên
→ Chỉ ra động lượng tăng mạnh
Cấu trúc giảm
EMA 50 dưới EMA 200
Giá dưới EMA 50
PSAR trên nến
Dải Bollinger mở rộng xuống dưới
→ Chỉ ra động lượng giảm mạnh
6. Phát Hiện Giai Đoạn Thị Trường
Chỉ báo này giúp xác định 3 giai đoạn thị trường:
Giai đoạn xu hướng
EMA thẳng hàng
PSAR nhất quán
Dải mở rộng
Tốt nhất cho giao dịch tiếp tục.
Giai đoạn nén
Dải chặt
EMA phẳng
PSAR đổi vị trí thường xuyên
Tốt nhất là chờ đợi phá vỡ.
Giai đoạn chuyển tiếp
EMA đang hình thành cắt nhau
PSAR đổi vị trí
Dải mở rộng
Có thể đảo chiều sớm.
7. Ví Dụ Luồng Thực Tiễn
Chuỗi tăng ví dụ:
Dải siết chặt
Nến tăng mạnh phá dải trên
EMA 50 cắt lên trên EMA 200
PSAR đổi vị trí dưới giá
Chuỗi này cho thấy:
Mở rộng biến động
Xác nhận xu hướng
Hỗ trợ tiếp tục
8. Những Điều Nó KHÔNG Làm
Không dự đoán tin tức
Không đảm bảo đảo chiều
Không đo lường dòng lệnh
Không loại bỏ các phá vỡ giả
Nó cung cấp xác nhận có cấu trúc, không phải sự chắc chắn.
9. Mô Hình Logic Tóm Tắt
Bộ lọc xu hướng → EMA
Bộ kích hoạt biến động → Dải Bollinger
Thời điểm & Theo dõi → Parabolic SAR
Cùng nhau, chúng giảm các lệnh ngẫu nhiên và cải thiện quyết định có cấu trúc.
Điều tốt về chỉ báo này là có thể cấu hình và không cần thiết lập nhiều chỉ báo.
Tóm tắt
1. Exponential Moving Averages (EMA 50 and EMA 200) to determine trend direction—EMA 50 reacts faster to price changes, while EMA 200 provides a longer-term trend perspective. The relative position of these EMAs signals bullish or bearish trends and potential trend shifts.
2. Bollinger Bands to measure market volatility and detect phases of compression (low volatility) and expansion (high volatility). Narrow bands indicate potential breakout setups, while price touching outer bands suggests possible overextension.
3. Parabolic SAR to identify trend continuation and reversal timing by plotting dots above or below price, signaling active uptrends or downtrends and potential reversals when dots flip position.
Together, these components form a structured decision framework that helps identify market phases—trending, compression, and transition—and supports confirmation of trend strength and momentum. The indicator is configurable and designed to reduce random entries by combining trend filtering, volatility triggers, and timing signals. It is applicable across various markets including Forex, cryptocurrencies, stocks, commodities, and indices. This tool provides structured confirmation for trading decisions but does not predict news events, guarantee reversals, or eliminate false breakouts.
Đánh giá của khách hàng
5 | 50 % | |
4 | 50 % | |
3 | 0 % | |
2 | 0 % | |
1 | 0 % |


