
Mô tả
RiskLotSizer là một chỉ báo quản lý rủi ro và kích thước vị trí dựa trên biểu đồ dành cho cTrader, được thiết kế để giúp các nhà giao dịch nhanh chóng và trực quan tính toán kích thước giao dịch phù hợp.
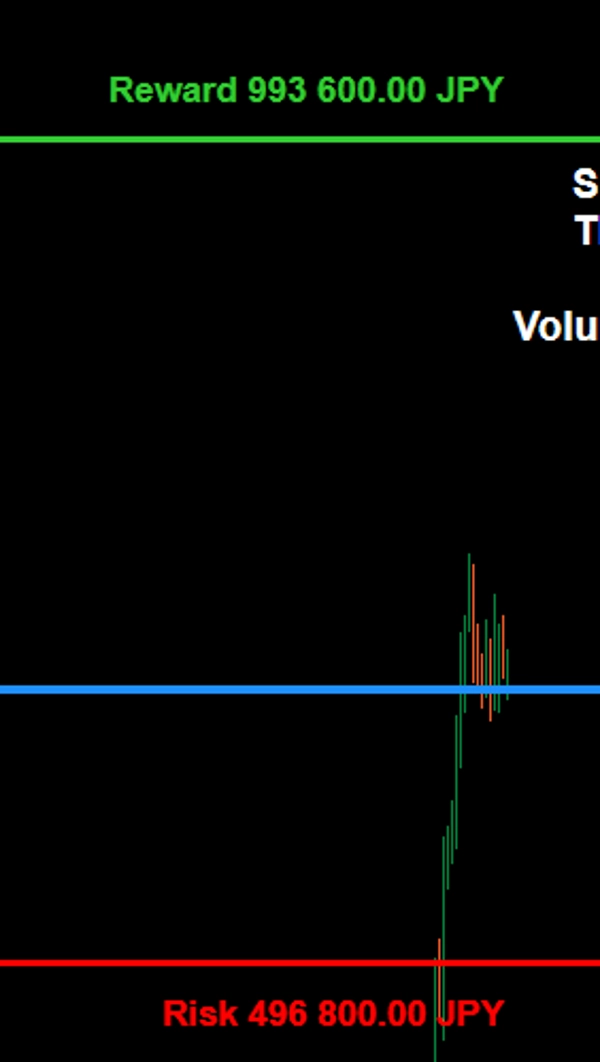
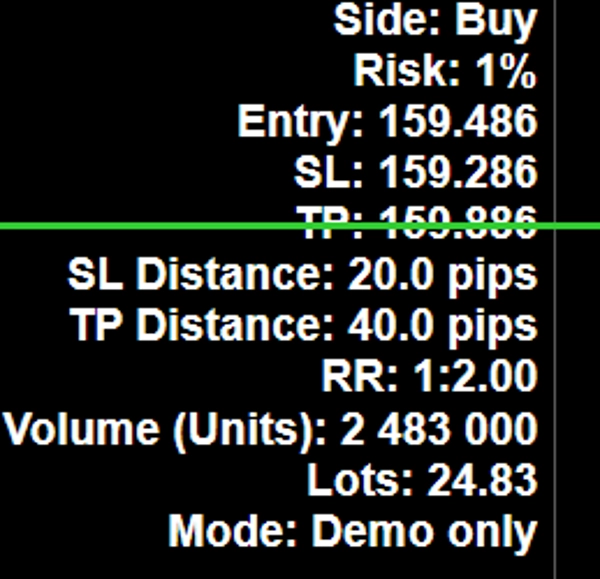
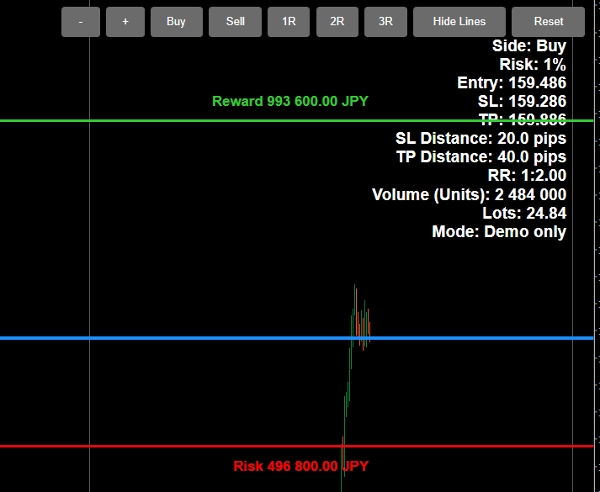
Chỉ báo cho phép bạn điều chỉnh các mức Entry, Stop Loss và Take Profit trực tiếp trên biểu đồ, giúp dễ dàng lập kế hoạch giao dịch trong thời gian thực. Dựa trên tỷ lệ phần trăm rủi ro bạn chọn trong vốn tài khoản, RiskLotSizer tự động tính toán kích thước vị trí và hiển thị kích thước lot ước tính, số tiền rủi ro, số tiền lợi nhuận và tỷ lệ rủi ro/lợi nhuận.
Nó hỗ trợ cả kịch bản Mua và Bán và được thiết kế để cung cấp cho các nhà giao dịch cái nhìn trực quan rõ ràng về rủi ro giao dịch trước khi vào vị trí. Giá trị rủi ro và lợi nhuận được hiển thị ngay gần các đường SL và TP, trong khi bảng thông tin chính cung cấp tóm tắt sạch sẽ về thiết lập.
Các tính năng chính bao gồm:
- Tính toán kích thước lot dựa trên tỷ lệ phần trăm vốn đã chọn
- Điều chỉnh trực tiếp các đường Entry, SL và TP trên biểu đồ
- Hiển thị kích thước vị trí, số tiền rủi ro, số tiền lợi nhuận và RR theo thời gian thực
- Hỗ trợ cả chế độ Mua và Bán
- Nút cài đặt trước RR nhanh để lập kế hoạch giao dịch nhanh hơn
- Hỗ trợ ngôn ngữ tiếng Anh và tiếng Nhật
- Chuyển đổi hiển thị đường để biểu đồ sạch hơn khi cần
RiskLotSizer lý tưởng cho các nhà giao dịch theo quyết định, nhà giao dịch trong ngày và bất kỳ ai muốn một cách nhanh hơn và rõ ràng hơn để xác định kích thước vị trí trong khi duy trì kiểm soát rủi ro nhất quán.
RiskLotSizer は、チャート上で直感的にポジションサイズを計算できる cTrader 用のポジションサイジング・リスク管理インジケーターです。
Entry、Stop Loss、Take Profit の各ラインをチャート上で直接動かしながら、指定した有効証拠金比率に基づく適正ロット数を自動計算します。これにより、トレード前に必要なロット数、想定損失額、想定利益額、Risk/Reward をリアルタイムで把握できます。
Buy / Sell の両方に対応しており、RR プリセットボタンによって利確目標の調整も素早く行えます。また、SL・TP 付近には損失額・利益額が表示されるため、視覚的にも分かりやすく、実践的なトレード設計をサポートします。
主な特長:
- 有効証拠金に対する指定リスク率からロット数を自動計算
- Entry / SL / TP をチャート上で直接調整可能
- ロット数、損失額、利益額、RR をリアルタイム表示
- Buy / Sell の両方に対応
- RR プリセットボタン搭載
- 英語 / 日本語切替対応
- 必要に応じてライン表示の ON / OFF が可能
RiskLotSizer は、裁量トレーダー、デイトレーダー、そして一貫したリスク管理を重視するトレーダーに適したインジケーターです。
Tóm tắt
Đánh giá của khách hàng
5 | 0 % | |
4 | 100 % | |
3 | 0 % | |
2 | 0 % | |
1 | 0 % |