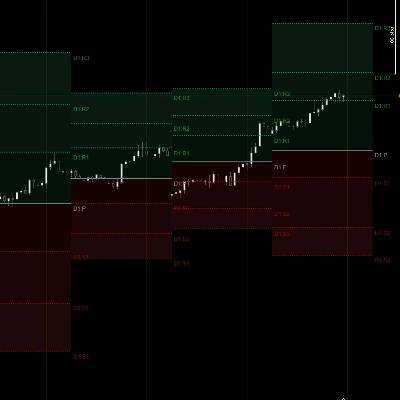
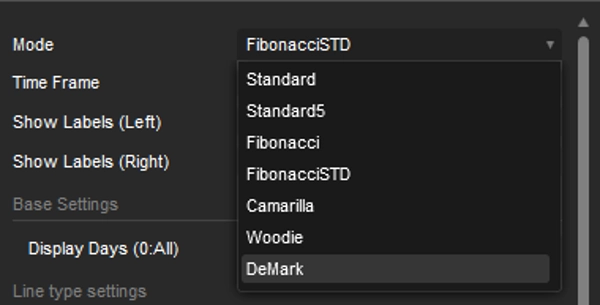
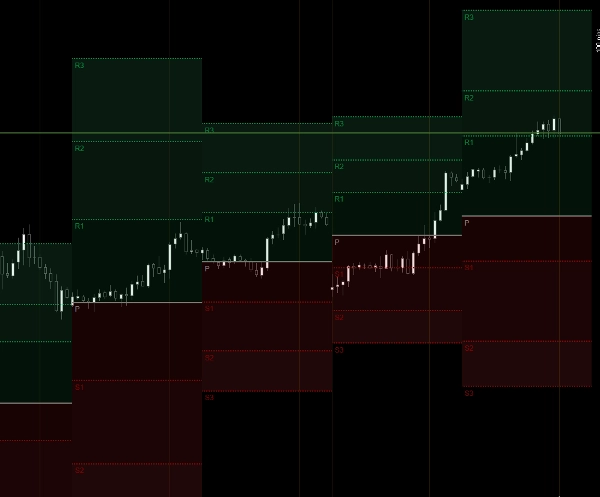
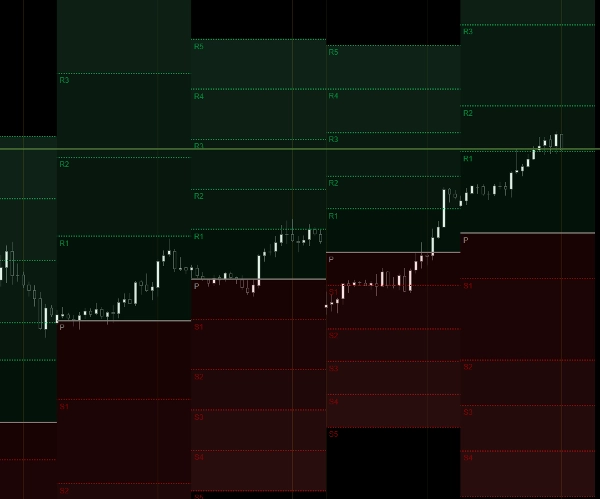
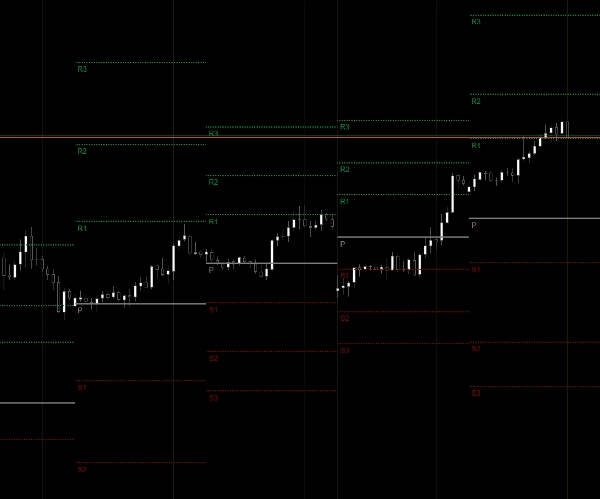
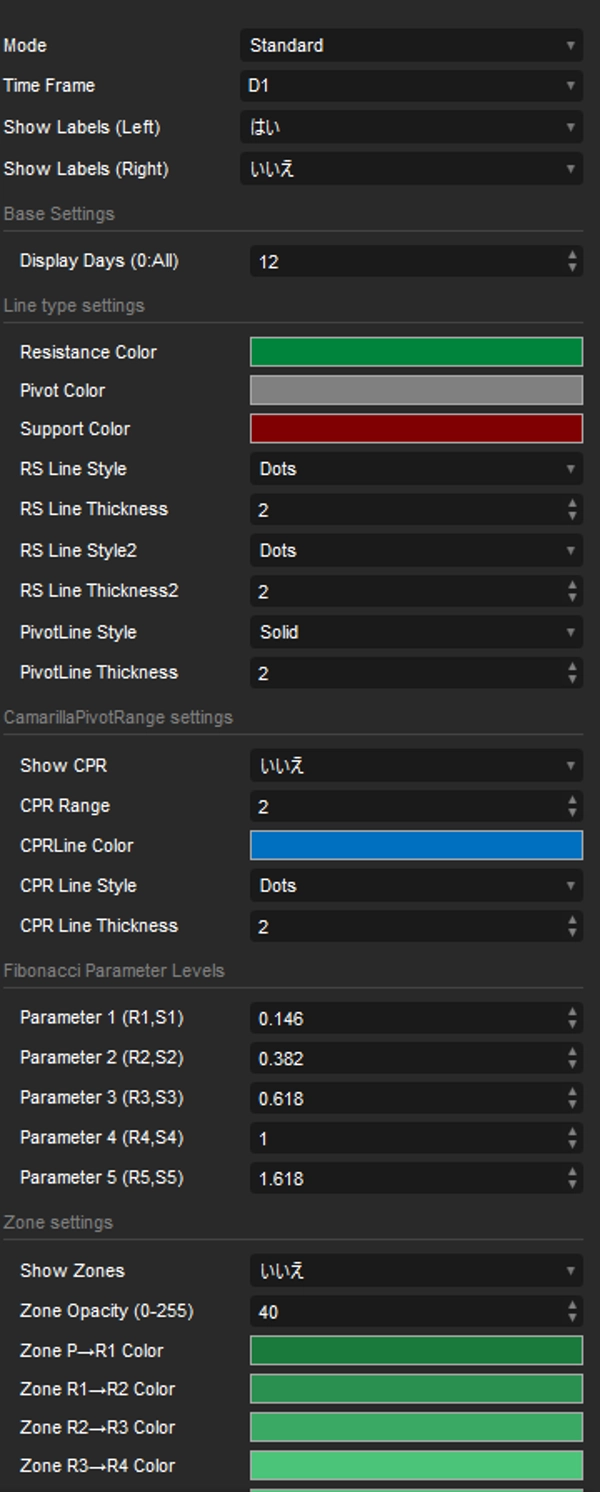
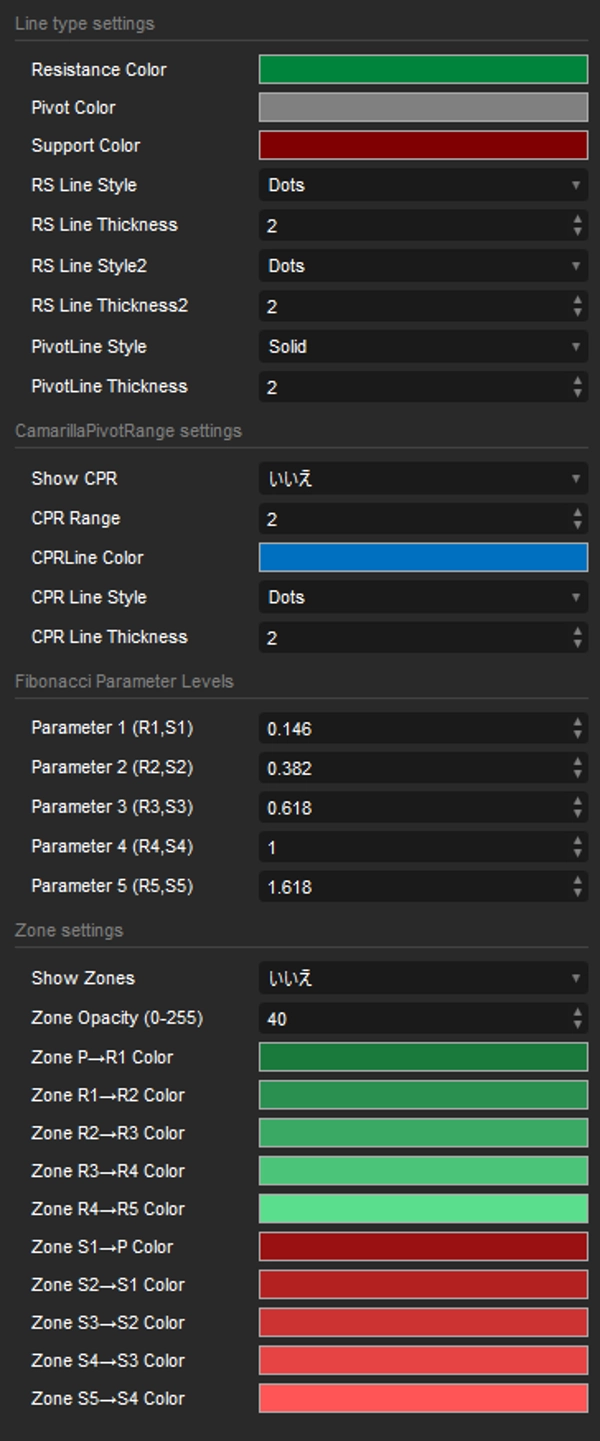
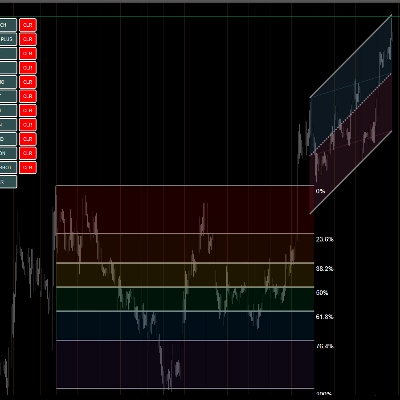
Logo "All PivotPoint Pro"
All PivotPoint Pro
Ảnh "All PivotPoint Pro" được tải lên
Kể từ 30/01/2025

AllPivotPointPro is a complete pivot‑point analysis tool supporting Standard, Fibonacci, Camarilla, Woodie, and DeMark modes. It automatically draws pivot, support, and resistance levels, CPR ranges, and multi‑level zones with customizable colors and opacity. The indicator displays both left‑side labels and right‑side TF‑based price labels (e.g., D1:R1), making intraday structure easy to read. Zone shading between each level provides clear visual context, while DisplayDays allows selective historical visibility. Designed for traders who rely on precise, clean, and multi‑mode pivot mapping for daily and intraday decision‑making.

Hồ sơ chỉ báo
0.0
Đánh giá: 0
Đánh giá của khách hàng
Sản phẩm này chưa có đánh giá nào. Bạn đã dùng thử chưa? Hãy là người đầu tiên chia sẻ với mọi người!
Support & Resistance
Các sản phẩm có sẵn trên cTrader Store, bao gồm bot giao dịch, chỉ báo và plugin, được cung cấp bởi các nhà phát triển bên thứ ba và chỉ nhằm mục đích cung cấp thông tin và tiếp cận kỹ thuật. cTrader Store không phải là nhà môi giới và không cung cấp lời khuyên đầu tư, khuyến nghị cá nhân hay bất kỳ đảm bảo nào về hiệu suất trong tương lai.

Sản phẩm khác của tác giả này

Detects and draws FVG, OB, NWOG, NDOG, and Equilibrium zones with auto mitigation and visual labeling.
A multifunctional drawing suite offering channels, Fibo tools, Gann tools, regression, and one‑shot ZigZag with a fully

Bạn cũng có thể thích

Institutional FVG detection with HTF projection, precise volume deltas, and smart fill logic.
Pulse Radar is a precision C#-based tool for tracking price momentum and cyclical shifts using adaptive high-speed and s
Order Flow Ticks v2.0
Yen Index
Detecting reversal zones + multidimensional mapping of support and resistance "Golden Levels.
Read aggressive flow in real time. Flexible resets (Day/Week/Month), optional EMA smoothing, and non-repainting cumulati
Overview of the Fade Breakout Visualizer Indicator
A precision tool for measuring how efficiently price moves from point A to B.
Momentum oscillator identifying reversals using dual WaveTrend lines, histogram, and OB/OS levels with optional signals.
Shows BUY & SELL signals for 3 & 4 BAR PATTERN (Morning star/ Evening star). It is adjustable and it will SHOW ARROWS.
Exploit market imbalances with auto FVG zones—fade, extend, and filter with precision.
uses HTF 1hr,4hr, 1D to check for valid directions enjoy
Polynomial Regression Channel which also reflects the volatility of the underlying asset.
Displays previous sessions POC line.
Smart Liquidity Zones PRO auto-detects liquidity grabs, wicks, traps & manipulations — trade like the smart money.
Highlights market sessions & overlaps with real-time range & volume stats – perfect for pro scalpers.
The CRT indicator helps ICT traders identify candlestick patterns, enhancing analysis of higher timeframe on lower
VolumeProfileSuite is an advanced and flexible Volume Profile indicator for cTrader.
Kể từ 30/01/2025