Açıklama
G.A.S - Akıllı Giriş Bölgesi, US500 (S&P 500 CFD) için fiyat hareketi göstergesidir ve
ticaret yapanların manuel olarak tanımlanmış bir fiyat bölgesi etrafında yüksek olasılıklı giriş noktalarını belirlemelerine yardımcı olur.
--- NEYİ ANALİZ EDER ---
Gösterge, kullanıcı tarafından tanımlanan iki yatay seviye etrafındaki fiyat davranışını izler -
Akıllı Giriş Bölgesi'nin üst ve alt sınırları. Fiyatın bu seviyelere nasıl yaklaştığını,
delip geçtiğini ve bu seviyelere bar bazında nasıl tepki verdiğini takip eder, belirli
onaylama desenlerini arar ve ardından bir sinyal üretir.
--- SİNYALLERİ VE GÖRSEL ÖĞELERİ NASIL YORUMLARSINIZ ---
Bölge çizgileri, seçilen işlem gününün giriş bölgesinin üst ve alt sınırlarını işaretler. Üç sinyal türü tespit edilir:
- Durum A - Fiyat bölgeyi fitil ile delip geçer ve ardından tekrar dışarıda kapanır. Kırılma yönünde kapanan takip eden bir mum sinyali tetikler. Her delme olayı için bir sinyal (tek seferlik).
- Durum B - Önceki bar bölgenin dışında kapandı, mevcut bar bölgeyi fitil ile delip geçer ve tekrar dışarıda kapanır. Bölge sınırının yeniden testini onaylar.
- Durum C - Sinyal zaman penceresinin tam açılışında, fiyat zaten bölgenin ötesindedir. O yöndeki ilk onaylayan mum sinyali tetikler.
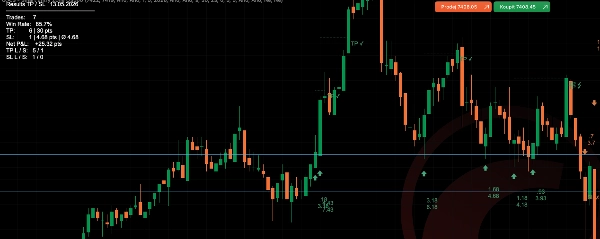
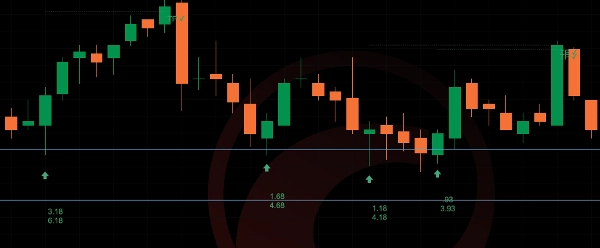
Sinyaller, sinyal barının altında (boğa) veya üstünde (ayı) oklar olarak gösterilir. TP/SL gösterimi etkinleştirildiğinde, noktalı çizgiler giriş barından kar alma ve zarar durdurma seviyelerini gösterir. Seviye vurulduğunda TP veya SL etiketi sonucu işaretler.
İsteğe bağlı SL Mesafe etiketi, mevcut fiyatın zarar durdurma bölgesi sınırından ne kadar uzakta olduğunu gerçek zamanlı olarak gösterir.
--- ANA AYARLAR VE PARAMETRELER ---
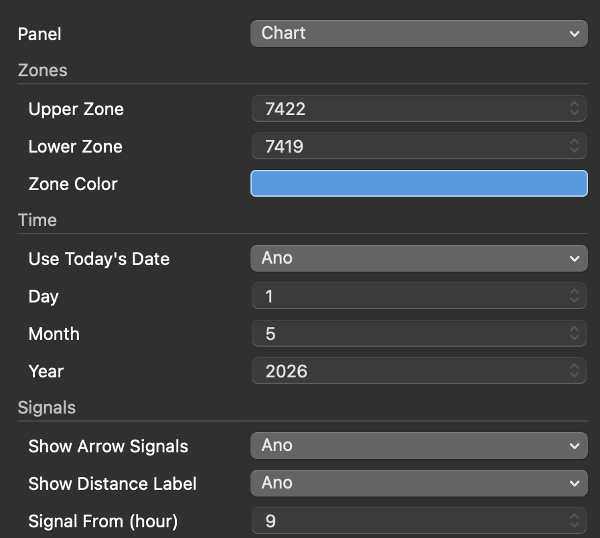
- Bölgeler: üst ve alt fiyat seviyesi, çizgi rengi, göster/gizle
- Tarih: bugünün tarihini otomatik kullan veya belirli bir tarihi manuel ayarla
- Sinyaller: okları etkinleştir, zaman penceresini yapılandır (ör. 15:30 / 23:00), delme geri bakışı (bir delmeden sonra sinyalin kaç bar geçerli kalacağı), mesafe etiketleri açık/kapalı
- TP/SL: puan cinsinden kar alma, çizgileri ve etiketleri göster, sonuç tablosu açık/kapalı, tek işlem modu (aynı anda bir açık işlem), özel renkler
- SL Mesafe: etiketi etkinleştir, özel renk
--- TİPİK KULLANIM DURUMLARI VE İŞLEM SENARYOLARI ---
Gösterge, US500'ün 5 dakikalık grafiğinde gün içi işlem için tasarlanmıştır. Tipik bir iş akışı şudur: ABD piyasası açılmadan önce, trader gün için üst ve alt bölge seviyelerini belirler. Sinyal penceresi açıldığında (varsayılan 15:30 Prag / 09:30 New York), gösterge Durum A, B veya C kurulumlarını izler ve geçerli girişleri oklarla işaretler. TP/SL takipçisi oturum boyunca sonuçları otomatik olarak kaydeder.
--- BU GÖSTERGE KİMLER İÇİN EN UYGUN ---
Zaten tanımlanmış bir gün içi metodolojisi olan ve karar süreçlerinde sabit fiyat bölgeleri kullanan orta ve ileri düzey traderlar için uygundur. Gösterge bölgeleri otomatik olarak oluşturmaz - trader her gün seviyeleri manuel olarak belirlemeli ve girmelidir. Tam otomatik bir sinyal sistemi arayan yeni başlayanlar için uygun değildir.
--- ÖNEMLİ SINIRLAMALAR VE KULLANIM NOTLARI ---
- Bölge seviyeleri her işlem günü manuel olarak girilmelidir - gösterge bunları otomatik hesaplamaz.
- US500 için 5 dakikalık grafikte tasarlanmış ve test edilmiştir. Diğer enstrümanlar veya zaman dilimlerindeki davranışı garanti edilmez.
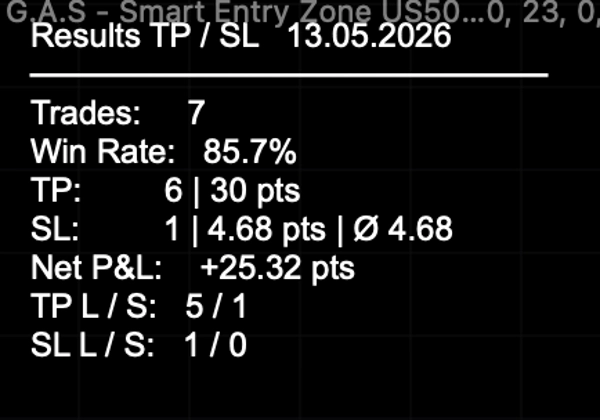
- Sonuç tablosunda gösterilen geçmiş sinyal istatistikleri sadece referans içindir ve gelecekteki performans garantisi değildir.
- Sinyal zaman penceresi dahili olarak Prag saatini (CET/CEST) kullanır. Brokerınız farklı bir sunucu saati kullanıyorsa, başlangıç/bitiş saat ayarlarını buna göre düzenleyin.
Özet
Signals appear as arrows indicating bullish or bearish entries, with optional automatic tracking and display of take profit (TP) and stop loss (SL) levels, including real-time SL distance labels. Users can customize zone levels, signal time windows, TP/SL parameters, and visual elements. The indicator logs trade statistics throughout the session for performance reference.
Intended for intermediate to advanced traders who incorporate fixed price zones into their intraday strategies, it requires manual input of zone levels daily and is specifically tailored for the US500 instrument. The indicator does not generate zones automatically and is not designed for other instruments or timeframes. Time settings use Prague time internally and should be adjusted if needed.


!["Smart Money Concepts (SMC) [Iridio Capital]" logosu](https://cdn.ctrader.com/image/webp/28b69fd1-ef54-4bed-9487-07e78e883be4_40934)