説明
セッション開始時に市場の正しい方向を判断するのが難しいですか?Daily Bias Candles & Levels Indicatorは、あなたの日々の分析を完全に自動化します。
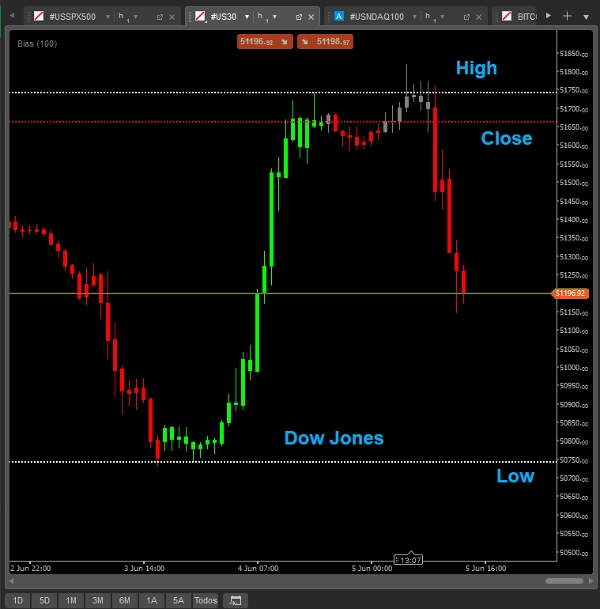
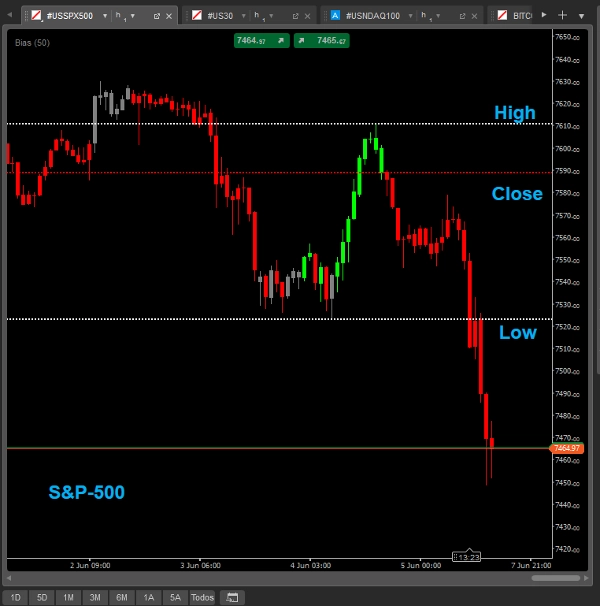
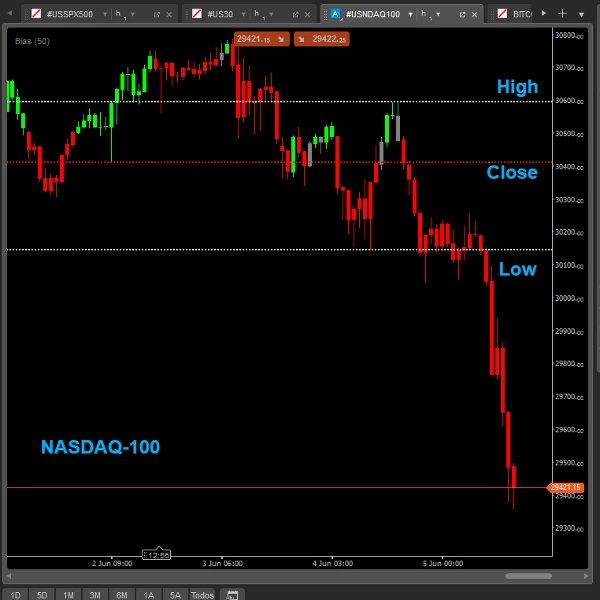
アルゴリズムは前のセッションの高値 (High)、安値 (Low)、および終値 (Close)を数学的に計算します。これらの重要なレベルに基づいて、インジケーターは市場が上昇継続ゾーン、下降継続ゾーン、調整フェーズ、または横ばいフェーズにあるかを正確に定義します。
取引中に集中力を失わないように、インジケーターはリアルタイムでローソク足に色を付けます。これにより、重要なレベルの上か下かを瞬時に把握でき、その日の真の機関投資家のバイアスに沿った戦略を実行できます。
ゾーンとローソク足のマッピングはどのように機能しますか?
- 上昇継続ゾーン (Bullish Extension): 価格が前の高値を突破し、その上で強く維持されるとカスタムカラーのローソク足が表示されます。上方向への拡張を狙う時です!
- 下降継続ゾーン (Bearish Extension): 価格が前の安値を下回るとカスタムカラーのローソク足が表示されます。大規模な売りの勢いに乗るのに最適です。
- 調整フェーズ / 横ばいレンジ: 価格が前の高値/安値と終値の間で動いているときは、中立色または警告色が表示されます。汚れた蓄積ゾーンや市場の罠での取引を防ぎます。
トレーディングプランを最適化し、市場の間違った側で取引するのを避け、スマートマネーの流動性を追いましょう。今すぐあなたのバージョンをダウンロードしてください!
概要
AIによる概要
Bias_Ctrader is a trading indicator designed to automate daily market bias analysis by calculating the previous session's High, Low, and Close prices for any asset. It visually colors candles in real time based on these key levels to indicate market phases: bullish continuation when price breaks above the prior High, bearish continuation when price falls below the prior Low, and neutral or warning colors during retracement or sideways ranges between these levels. This color-coded system helps traders quickly identify whether the market is trending upward, downward, or consolidating, supporting alignment with institutional market bias. The indicator is applicable across various assets and integrates key concepts such as market structure, order blocks, supply and demand zones, and liquidity grabs. It provides visual cues directly on price charts to assist in decision-making without requiring manual calculation of prior session levels.
インジケーターのプロフィール
インジケーターのカテゴリー
トレンド
出力の種類
ビジュアル表示
フィルター
データ要件
バーのみ
サポート対象のシグナル
トレンドの強さ
反転
ラインタッチ
カスタマーレビュー
0.0
レビュー: 0
カスタマーレビュー
この商品にはまだレビューがありません。お使いになったことがある方は、ぜひレビューをお願いします。
ディスカッション
よくあるご質問
Supertrend
Imbalance
Order Block
Market Structure
Supply & Demand
Liquidity Grab
Support & Resistance
cTrader Storeで入手可能な取引ボット、インジケーター、プラグインなどの商品は、第三者の開発者が提供するものであり、情報と技術の取得のみを目的としてご利用いただけます。cTrader Storeはブローカーではなく、投資助言や個人的な推奨を行うことも、将来のパフォーマンスを保証することもありません。
この作成者の他の商品


価格
登録日 10/03/2026
2
販売