

Descripción
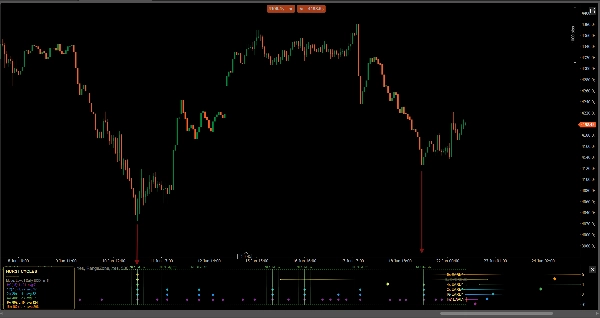
MTC Hurst Cycle Akademica mapea la estructura cíclica de cualquier mercado, nivel por nivel, en un subpanel dedicado. Basado en el modelo de mercado cíclico de J. M. Hurst, marca los valles de ciclo confirmados (y opcionalmente los picos) de cada nivel de ciclo habilitado como diamantes codificados por colores, proyecta el momento del próximo valle de ciclo esperado y resalta el "Nido de Valles" — barras donde se espera que coincidan varios valles de ciclo, el contexto clásico de alta probabilidad de giro de Hurst.
CARACTERÍSTICAS CLAVE
• 7 niveles de ciclo anidados (HC, 1C, 2x, 4x, 8x, 16x, 32x) — habilita cualquier combinación.
• Diamantes solo confirmados — los marcadores más recientes NO se reescriben en la barra en vivo.
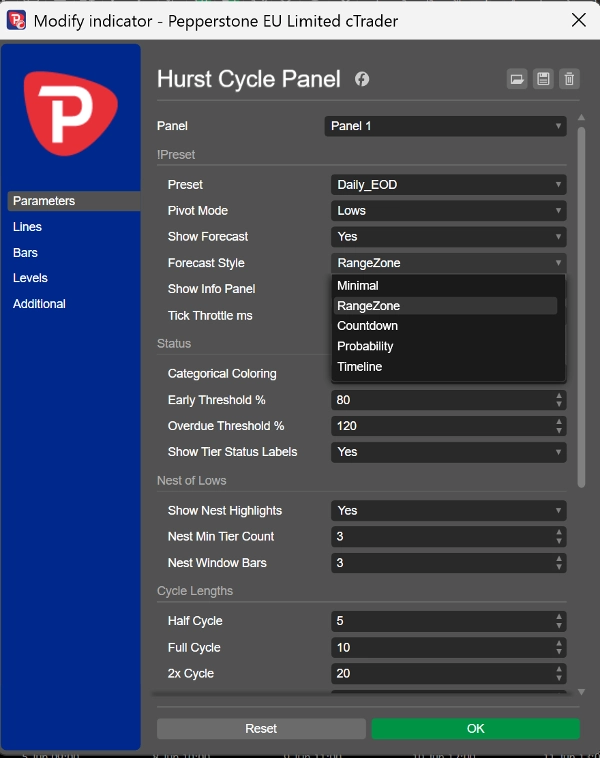
• Pronóstico del próximo valle en 5 estilos de visualización: Mínimo, Zona de Rango, Cuenta Regresiva, Probabilidad (1σ / 2σ), Línea de Tiempo.
• Resaltado de "Nido de Valles", escalado automáticamente a las longitudes de ciclo habilitadas.
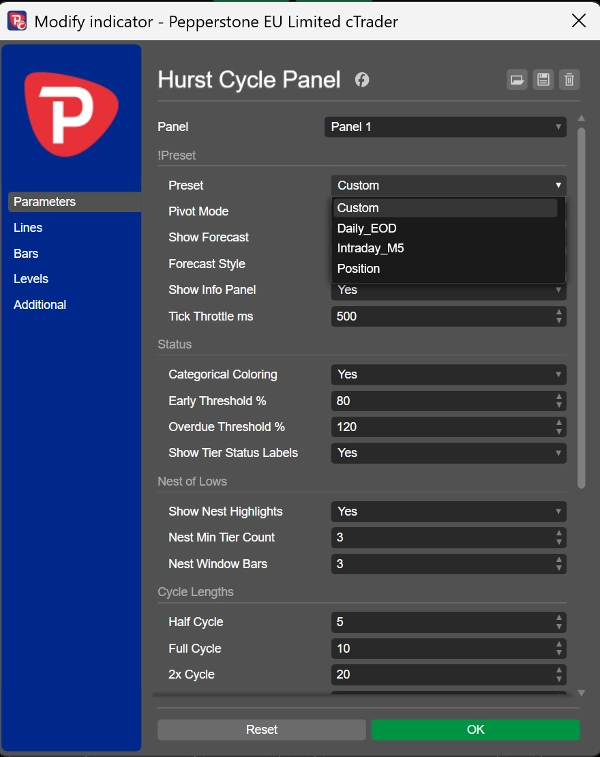
• Preajustes con un clic: EOD diario, Intradía M5, Posición — o longitudes de ciclo totalmente personalizadas.
• Panel de información moderno en el gráfico: conteos de pivotes por nivel, longitud promedio de ciclo medida (mostrada solo cuando es estadísticamente significativa) y una verificación de razón armónica.
• Modo pivote: Valles, Picos o Ambos.
• Escala de ajuste automático, renderizado limpio y sin parpadeos.
CÓMO USAR
Agrégalo debajo de tu gráfico de precios. Lee los diamantes más bajos y el resaltado del "Nido" como la columna vertebral del tiempo del ciclo del mercado, y usa el pronóstico para anticipar la ventana temporal del próximo giro. Se combina naturalmente con MTC Hurst FLD Akademica (niveles de precio) y MTC Hurst Pulse Akademica (oscilador de madurez del ciclo).
FUNCIONA EN
Cualquier símbolo y cualquier marco temporal.
DESCARGO DE RESPONSABILIDAD
Esta es una herramienta de análisis técnico y visualización basada en la teoría del mercado cíclico de J. M. Hurst. No realiza órdenes ni garantiza rendimiento, precisión o ganancias. El análisis de ciclos es probabilístico y las proyecciones futuras son estimaciones, no predicciones. Siempre aplica tu propia gestión de riesgos y juicio. El comportamiento pasado del mercado no garantiza resultados futuros.
Resumen
Key features include seven nested cycle tiers (HC, 1C, 2x, 4x, 8x, 16x, 32x) with customizable combinations, one-click presets for common timeframes (Daily EOD, Intraday M5, Position), and a modern on-chart info panel showing pivot counts, average cycle length, and harmonic-ratio checks. Users can select pivot modes (Lows, Highs, or Both) and benefit from auto-fitting scale and flicker-free rendering.
The panel works on any symbol and timeframe and is intended as a visualization tool to aid cycle timing analysis. It complements other Hurst-based tools for price levels and cycle maturity oscillation.









![Logotipo de "[Hamster-Coder] Pivot Points MTF"](https://cdn.ctrader.com/image/webp/4c143e5a-309c-40e3-a578-f04d1e133ffa_31159)










