Mô tả
MTC INTERACTIV RAINBOW PRO
TẠI SAO CẦU VỒNG NÀY KHÁC BIỆT
Các chỉ báo cầu vồng đã tồn tại nhiều năm, là những dải trung bình động đẹp mắt trên biểu đồ. Vấn đề: hầu như không ai thực sự biết cách đọc chúng hoặc biến chúng thành các quyết định. Chúng trông rất đẹp… rồi lại bị bỏ không sử dụng.
MTC Interactiv Rainbow Pro khắc phục chính xác điều đó, một cách tương tác. Thay vì nhìn chằm chằm vào hàng chục đường màu sắc và đoán mò, bạn làm việc CÙNG cầu vồng: di chuột, nhấp, tập trung, đo lường và để biểu đồ tự giải thích.
BẠN THẤY GÌ
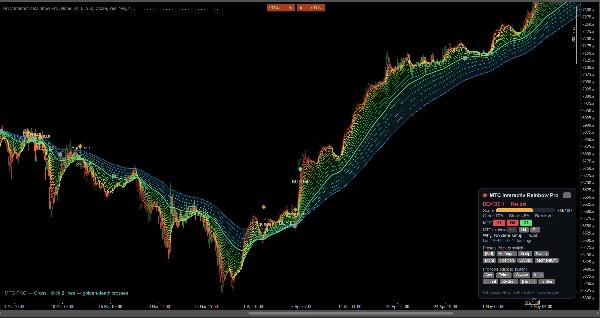
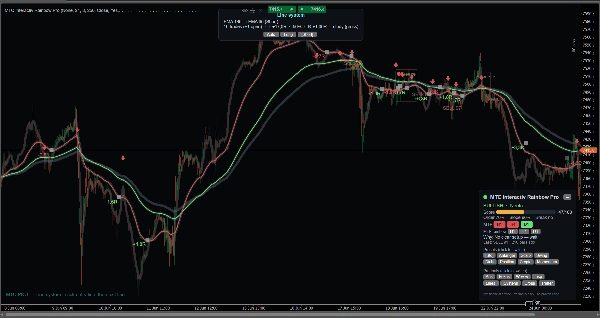
• Một cầu vồng EMA dày đặc, mượt mà cho thấy hướng xu hướng, sức mạnh và động lượng chỉ trong một cái nhìn.
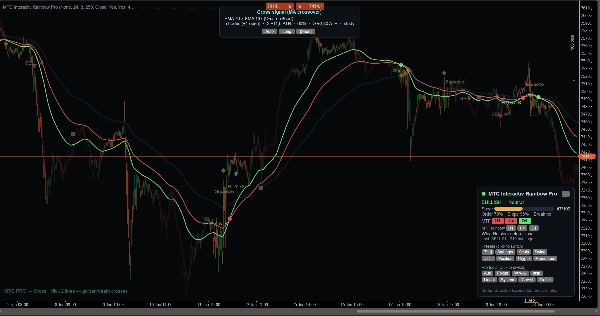
• Các dấu hiệu MUA / BÁN / THOÁT rõ ràng và các vùng siết chặt/phá vỡ — tất cả trên các thanh đã đóng, không vẽ lại.
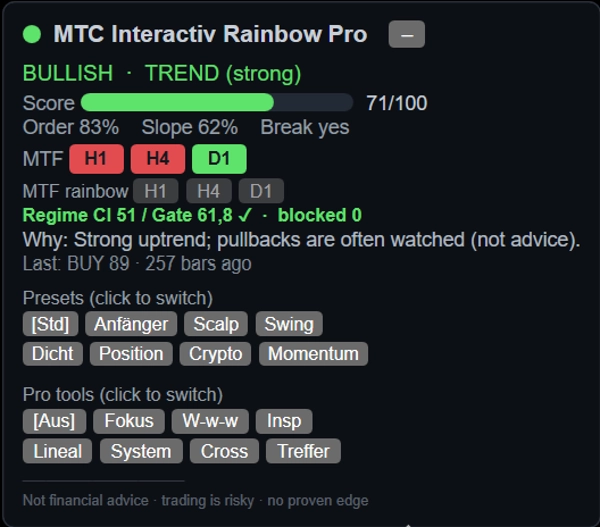
• Bảng điều khiển trực tiếp gọn gàng: hướng đi, điểm sức mạnh 0–100, các chỉ số đơn hàng/dốc/phá vỡ, đồng thuận đa khung thời gian và lời giải thích bằng ngôn ngữ đơn giản "tại sao".
ĐIỀU GÌ KHIẾN NÓ TƯƠNG TÁC (phần mà không ai khác cung cấp cho bạn)
• Di chuột qua bất kỳ đường nào để ngay lập tức thấy chu kỳ EMA của nó — cuối cùng bạn biết được trung bình nào bạn đang nhìn.
• Tập trung vào một đường duy nhất và làm mờ phần còn lại để có cái nhìn rõ ràng.
• Công cụ "Nếu như" và Kiểm tra để nghiên cứu bất kỳ thanh hoặc tín hiệu quá khứ nào.
• Thước đo tích hợp (ATR / R / pips).
• Nghiên cứu Hệ thống Đường & Giao cắt để khám phá cách hai trung bình tương tác.
• Nghiên cứu tỷ lệ tôn trọng: tần suất giá thực sự tôn trọng một đường đã chọn.
• Chồng cầu vồng MTF chỉ với một cú nhấp: xem cầu vồng H1 / H4 / D1 trên biểu đồ hiện tại của bạn bằng màu xám.
• 8 cài đặt sẵn một cú nhấp (Người mới, Scalp, Swing, Vị thế, Crypto, Động lượng, Dày đặc, Tiêu chuẩn).
• Bộ lọc chế độ tùy chọn và lớp phủ quản lý giao dịch (dừng cấu trúc, dải rủi ro 1R, đường trailing) cho tư duy rủi ro có kỷ luật.
CÁCH ĐỌC NÓ
Xòe ra và có thứ tự = xu hướng mạnh. Siết chặt lại = cuộn lại, một đột phá sắp xảy ra. Mũi tên lên/xuống = tín hiệu đột phá. Dải càng dày đặc và có thứ tự, chuyển động càng mạnh. Một hướng dẫn tương tác tích hợp (tiếng Anh & tiếng Đức) sẽ hướng dẫn bạn từng bước.
DÀNH CHO AI
• Người mới bắt đầu luôn muốn sử dụng cầu vồng nhưng chưa bao giờ biết cách — các công cụ tương tác sẽ dạy bạn khi bạn sử dụng.
• Các nhà giao dịch có kinh nghiệm muốn đọc nhanh, rõ ràng về xu hướng, động lượng và bối cảnh đa khung thời gian.
• Người xây dựng bot: cơ sở nghiên cứu minh bạch cho các chiến lược và bot EMA / MA của riêng bạn.
Hoạt động trên bất kỳ ký hiệu và khung thời gian nào; các công cụ tương tác tỏa sáng trên M5–H4. Không yêu cầu kích thước tài khoản tối thiểu — đây là công cụ phân tích, không phải trình tự động giao dịch.
QUAN TRỌNG — VUI LÒNG ĐỌC
Đây là công cụ phân tích và học tập, KHÔNG phải lời khuyên đầu tư và không đảm bảo lợi nhuận. Tất cả tín hiệu, điểm số và giao dịch mô phỏng chỉ là quan sát, không phải lợi thế được chứng minh bằng thống kê. Giao dịch có đòn bẩy có rủi ro và có thể dẫn đến mất toàn bộ. Luôn tự đưa ra quyết định và thử nghiệm trên tài khoản demo trước.
Tóm tắt
Key features include an interactive interface allowing users to hover over lines to identify EMA periods, focus on individual lines, and use tools like "What-if" analysis, inspection of past signals, and a built-in ruler measuring ATR, price range, and pips. The indicator offers line-system and cross studies to analyze interactions between averages, a respect-rate study to assess price adherence to specific lines, and a one-click multi-timeframe rainbow overlay showing higher timeframe EMAs in grey.
A compact live dashboard provides a 0–100 strength score, order, slope, breakout readings, multi-timeframe consensus, and plain-language explanations. Eight one-click presets cater to various trading styles and markets, including scalp, swing, position, crypto, and momentum trading. Additional features include an optional regime filter and trade-management overlays for risk control.
Suitable for all symbols and timeframes, especially effective on M5 to H4 charts, this tool supports traders ranging from beginners learning to use EMA rainbows to experienced traders and bot developers seeking a transparent EMA research base.