


Deskripsi
Flintridge Trader Pro menandai di mana harga sudah menunjukkan arahnya, dan kemudian memberi tahu Anda kapan pasar berbalik di tempat-tempat tersebut.
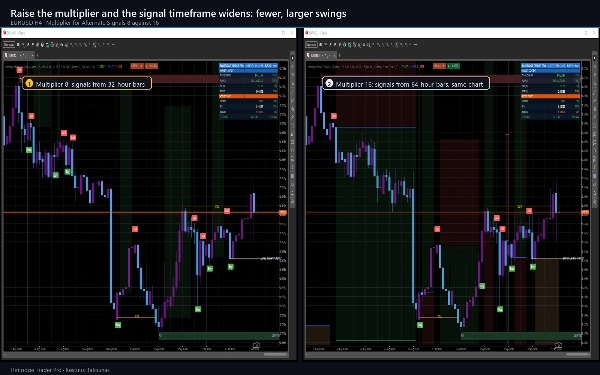
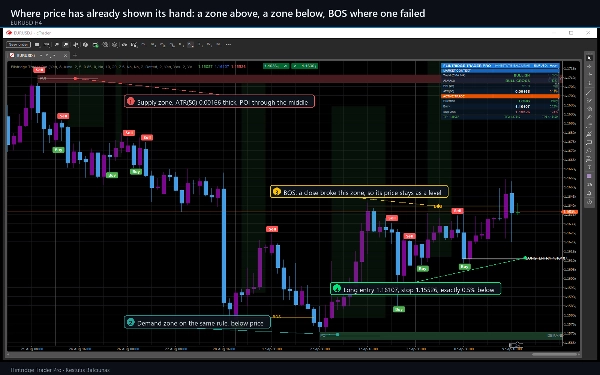
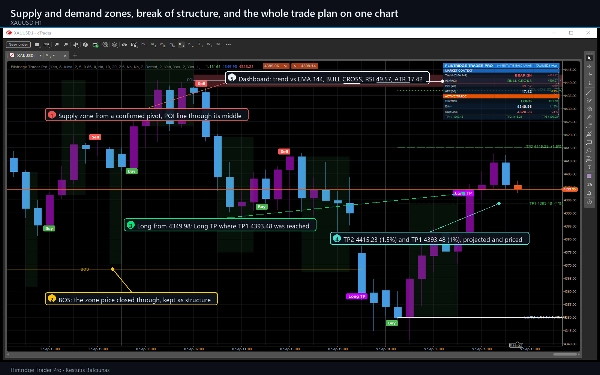
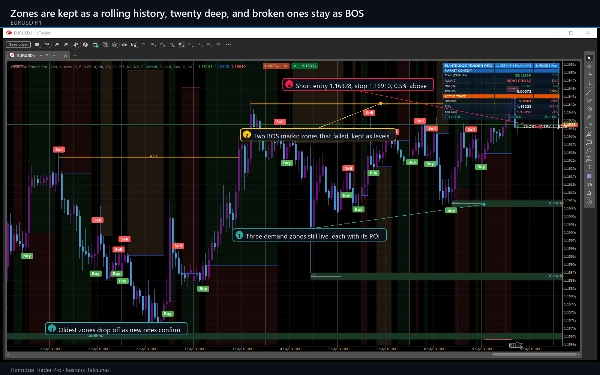
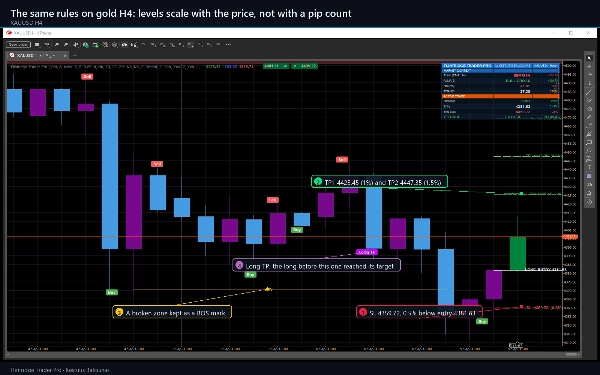
Pivot ayunan yang dikonfirmasi membangun zona pasokan dan permintaan, masing-masing berupa pita setebal ATR dengan titik minatnya di tengah. Ketika harga menutup melewati zona, itu diubah menjadi break of structure dan ditandai BOS, sehingga level yang gagal tetap ada di grafik sebagai informasi daripada menghilang. Secara terpisah, rata-rata bergerak dari penutupan dan rata-rata bergerak dari pembukaan dihitung pada timeframe YANG LEBIH TINGGI - delapan kali chart Anda secara default - dan crossover mereka adalah sinyalnya.
Apa yang digambar pada grafik Anda
- Zona pasokan dan permintaan dari pivot ayunan yang dikonfirmasi, masing-masing dengan garis POI, disimpan sebagai riwayat bergulir dan diubah menjadi tanda BOS saat ditembus.
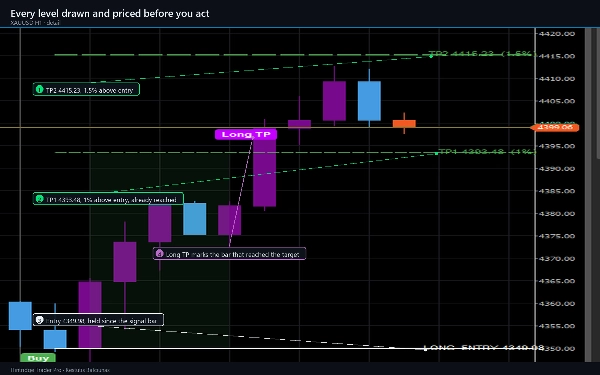
- Penanda Beli dan Jual, serta penanda TP dan SL Long saat level tercapai.
- Entri, stop, dan target pertama sebagai garis bertahap, dengan pita risiko yang diarsir dan pita imbal hasil yang diarsir di antara keduanya.
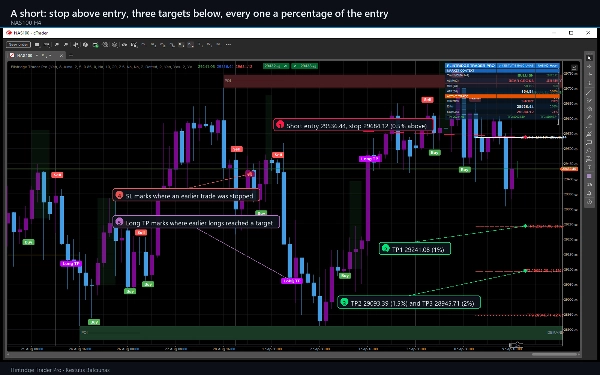
- Sinyal terakhir yang diproyeksikan ke depan, dengan entri, stop, dan ketiga target digambar dan diberi label dengan harga dan persentasenya.
- Label ayunan HH, LH, HL, dan LL opsional, serta lapisan support dan resistance opsional dengan hingga 21 level dan zonanya.
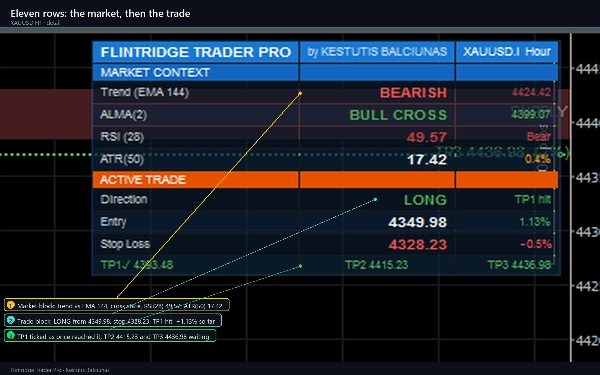
- Dashboard sebelas baris: tren terhadap EMA 144, status crossover, RSI, ATR, kemudian perdagangan langsung dengan arah, tahap, entri, stop, dan tiga targetnya, masing-masing dicentang saat harga mencapainya.
- Lilin diwarnai ulang sehingga arah setiap bar dapat dibaca sekilas.
Cara berdagang dengannya
- Berikan riwayat. Pada pengaturan default, dibutuhkan sekitar 250 bar sebelum sesuatu muncul, dan dibutuhkan cukup data pada timeframe yang lebih tinggi agar crossover pertama ada.
- Baca zona terlebih dahulu. Beli di dalam zona permintaan dan Jual di dalam zona pasokan adalah setup yang dibuat alat ini untuk ditunjukkan kepada Anda.
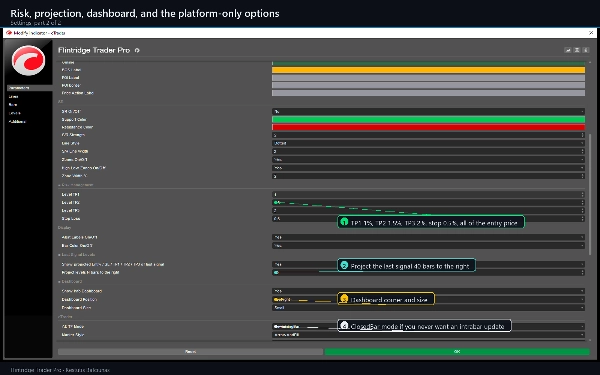
- Ambil level seperti yang digambar. Stop dan tiga target adalah persentase dari harga entri, 0,5, 1, 1,5, dan 2 secara default, dan semuanya ada di grafik sebelum Anda bertindak.
- Gunakan dashboard untuk konteks, bukan izin. Tren, crossover, RSI, dan ATR menggambarkan pasar; tidak ada yang memblokir sinyal kecuali Anda mengaktifkan filter opsional.
Pengaturan yang paling penting
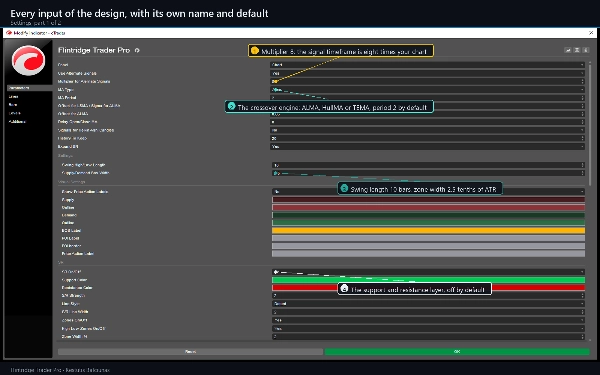
- Tipe MA dan Periode MA memilih mesin crossover: ALMA, HullMA, atau TEMA.
- Pengali untuk Sinyal Alternatif mengatur seberapa tinggi timeframe sinyal dibandingkan chart Anda.
- Panjang Swing High/Low dan Lebar Kotak Pasokan/Permintaan mengontrol berapa banyak zona yang Anda dapatkan dan seberapa tebal mereka.
- Level TP1, TP2, TP3 dan Stop Loss adalah persentase dari entri, dan posisi short menggunakan empat angka yang sama.
- Tiga filter opsional - gerbang tren EMA 144, gerbang RSI, dan jarak bar minimum antara entri - disediakan untuk trader yang menginginkan sinyal lebih sedikit. Mereka MATI secara default.
Di mana alat ini bekerja
Simbol dan timeframe apa pun. Ini dirancang untuk M15, H1, dan H4, dan cocok untuk forex mayor, emas, dan indeks utama; juga bekerja pada kripto, di mana zonanya cenderung lebih lebar karena ATR. Timeframe yang lebih rendah memberikan lebih banyak sinyal, itulah sebabnya filter opsional dan pengali timeframe yang lebih tinggi ada untuk mengendalikannya.
Peringatan
Dua belas peristiwa, masing-masing dengan saklar sendiri: entri long dan short, tiga target untuk setiap arah, dan stop. Mereka dikirim ke log cTrader, suara opsional, dan email cTrader sendiri. Peringatan hanya aktif pada bar yang sudah tertutup, tidak pernah untuk riwayat yang sudah tertutup sebelum Anda memasang indikator, dan tidak pernah dua kali untuk bar yang sama.
Persyaratan dan perilaku
cTrader 5.0 atau lebih baru, desktop. Indikator ini tidak meminta hak akses: tidak membuka koneksi jaringan, tidak membaca file, dan tidak pernah menempatkan, memodifikasi, atau menutup order. Sinyal dievaluasi pada bar yang tertutup dan tidak berubah setelahnya. Dua hal bersifat sementara saat bar terbaru terbentuk - zona terbaru, yang pivotnya belum dikonfirmasi, dan nilai timeframe yang lebih tinggi, yang dibaca dari bar yang berisi bar saat ini. Ada pengaturan untuk membaca bar timeframe yang lebih tinggi yang sudah selesai sebelumnya, yang tidak pernah melakukan repaint.
Ini adalah perangkat lunak analitis dan apa pun yang digambarnya bukanlah nasihat. Tanda target dan stop hanya mencatat bahwa harga menyentuh level yang digambar pada riwayat yang dimuat; tidak ada spread, komisi, atau slippage di baliknya dan tidak ada order yang ditempatkan.
Perdagangan melibatkan risiko. Kinerja masa lalu tidak menjamin hasil di masa depan.
Ringkasan
Key chart elements include supply and demand zones with points of interest, buy/sell markers, entry, stop loss, and three target levels displayed as stepped lines with shaded risk and reward bands. Optional swing labels (HH, LH, HL, LL) and a support/resistance layer with up to 21 levels are available. An eleven-row dashboard provides market context with trend, crossover state, RSI, ATR, and live trade details including stage, entry, stop, and targets.
Flintridge Trader Pro supports any symbol and timeframe, optimized for M15, H1, and H4 charts, and is suitable for forex majors, gold, major indices, and cryptocurrencies. It includes configurable settings for moving average type, swing length, zone width, and risk parameters. Alerts cover entries, targets, and stops, firing on closed bars only. The indicator is analytical software that does not place or manage orders.





























