Mô tả
Chỉ Báo Phân Cụm
Tổng Quan
Chỉ Báo Phân Cụm là một công cụ mạnh mẽ được thiết kế để giúp các nhà giao dịch xác định các mẫu, xu hướng và bất thường trong dữ liệu thị trường. Bằng cách nhóm các điểm dữ liệu tương tự thành các cụm, chỉ báo này cung cấp những hiểu biết quý giá có thể được sử dụng để đưa ra các quyết định giao dịch thông minh.
Tính Năng
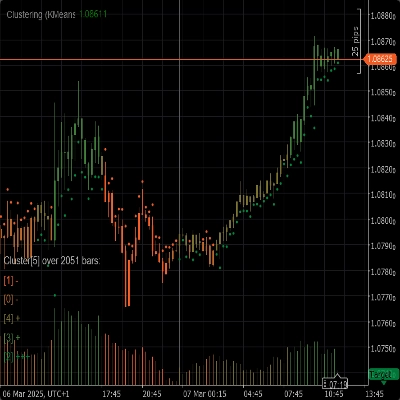
- Thuật Toán Phân Cụm: Sử dụng các thuật toán phân cụm tiên tiến như K-Means và Mô Hình Hỗn Hợp Gaussian (GMM) để phân đoạn dữ liệu thị trường một cách hiệu quả.
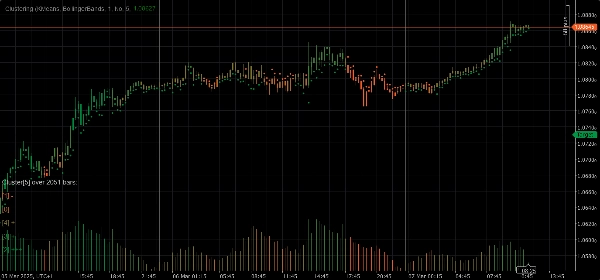
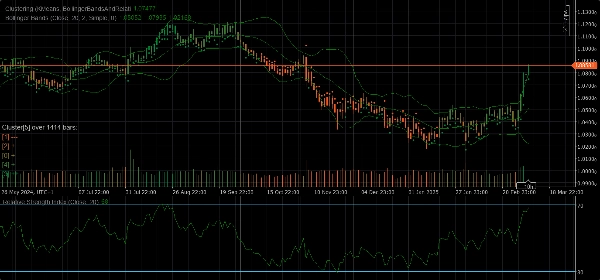
- Bộ Tính Năng: Cung cấp nhiều bộ tính năng bao gồm Giá Gốc, Dải Bollinger, Chỉ Số Sức Mạnh Tương Đối (RSI), Bộ Dao Động Stochastic, Dải Bollinger và RSI, cùng các kết hợp của các chỉ báo này để nắm bắt các khía cạnh khác nhau của hành vi thị trường.
- Phân Cụm Động: Tự động xác định số lượng cụm tối ưu đảm bảo phân cụm chính xác nhất có thể.
- Trực Quan Hóa: Cung cấp cái nhìn trực quan rõ ràng về chuyển động cụm và biến động ngay trên biểu đồ của bạn.
Tham Số
- Thuật Toán Phân Cụm: Chọn giữa K-Means hoặc Mô Hình Hỗn Hợp Gaussian (GMM) để phù hợp nhất với chiến lược giao dịch của bạn.
- Bộ Tính Năng: Chọn từ Giá Gốc, Dải Bollinger, RSI, Bộ Dao Động Stochastic, Dải Bollinger và RSI, hoặc một bộ dữ liệu thị trường đầy đủ bao gồm nhiều chỉ báo khác nhau.
- Cửa Sổ: Xác định số lượng thanh được xem xét cho mỗi điểm dữ liệu.
- Tự Động K: Tự động xác định số lượng cụm dựa trên dữ liệu của bạn.
- K Ban Đầu: Đặt số lượng cụm ban đầu nếu Tự Động K bị tắt.
- Số Thanh Lịch Sử Tối Đa: Giới hạn số lượng thanh lịch sử tối đa được sử dụng cho phân cụm. Nếu đặt là 0, tất cả các thanh có sẵn sẽ được sử dụng.
- Tô Màu Theo Cụm: Bật hoặc tắt việc tô lại màu biểu đồ dựa trên phân cụm thực tế.
- Hiển Thị Thông Tin: Hiển thị thông tin chi tiết về từng cụm ngay trên biểu đồ.
- Hiển Thị Chỉ Báo: Hiển thị các chỉ báo được sử dụng trong các bộ tính năng.
Tham Số Tự Điều Chỉnh
- Tự Điều Chỉnh: Bật hoặc tắt chế độ tự điều chỉnh, cho phép chỉ báo khởi tạo lại các cụm dựa trên các điều kiện đã chỉ định.
- Giờ Tự Điều Chỉnh: Giờ trong ngày khi tự điều chỉnh có thể xảy ra (0-23).
- Khoảng Thời Gian Tự Điều Chỉnh: Số giờ tối thiểu phải trôi qua kể từ lần điều chỉnh cuối cùng trước khi có thể thực hiện điều chỉnh tiếp theo.
Tham Số Bộ Tính Năng
Tham Số Dải Bollinger
- Chu Kỳ: Chu kỳ để tính toán Dải Bollinger.
- Độ Lệch: Hệ số độ lệch chuẩn cho Dải Bollinger.
- Loại Trung Bình Động: Loại trung bình động được sử dụng trong tính toán Dải Bollinger (Đơn giản, Lũy tiến, v.v.).
Tham Số Chỉ Số Sức Mạnh Tương Đối (RSI)
- Chu Kỳ: Chu kỳ để tính toán RSI.
Tham Số Bộ Dao Động Stochastic
- Chu Kỳ: Chu kỳ K cho Bộ Dao Động Stochastic.
- K Làm Chậm: Hệ số làm chậm K cho Bộ Dao Động Stochastic.
- Chu Kỳ D: Chu kỳ D cho Bộ Dao Động Stochastic.
- Loại Trung Bình Động: Loại trung bình động được sử dụng trong tính toán Bộ Dao Động Stochastic (Đơn giản, Lũy tiến, v.v.).
- Loại Tính Toán: Loại tính toán cho Bộ Dao Động Stochastic (LowHigh, CloseClose, v.v.).
Cách Sử Dụng
1. Thêm Chỉ Báo Phân Cụm vào biểu đồ của bạn.
2. Cấu hình các tham số theo chiến lược giao dịch của bạn.
3. Phân tích các cụm và chuyển động của chúng trên biểu đồ.
4. Sử dụng những hiểu biết do chỉ báo cung cấp để đưa ra các quyết định giao dịch thông minh.
Tóm tắt
Đánh giá của khách hàng
5 | 50 % | |
4 | 50 % | |
3 | 0 % | |
2 | 0 % | |
1 | 0 % |


![Logo "[Hamster-Coder] Moving Average MTF"](https://cdn.ctrader.com/image/webp/b11b98b1-194d-4b8e-b00e-d611826ad159_31226)


