
Mô tả
Các Mức Số Tròn - Chỉ Báo cho cTrader
Mô Tả
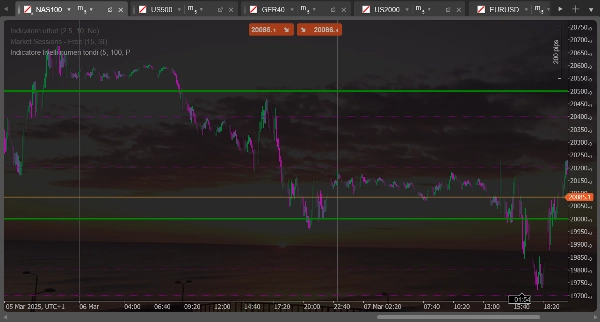
Chỉ báo này vẽ các đường ngang tại các "số tròn" hoặc các mức có ý nghĩa tâm lý trên biểu đồ. Nó lý tưởng để xác định các khu vực hỗ trợ và kháng cự tiềm năng dựa trên các mức giá tròn thường có tầm quan trọng tâm lý đối với các nhà giao dịch.
Các Chức Năng Chính
- Vẽ hai bộ đường ngang riêng biệt với khoảng cách đều đặn
- Tự động tính toán các mức dựa trên giá đóng cửa hiện tại
- Cập nhật động khi giá di chuyển
- Cung cấp cấu hình riêng biệt cho mỗi bộ đường (màu sắc, kiểu, kích thước)
Các Điều Chỉnh Có Thể
Đối với bộ đường đầu tiên (đường nét đứt)
- Số Đường Bộ 1: Xác định số đường vẽ phía trên và dưới giá hiện tại (mặc định: 5)
- Kích Thước Khoảng Cách Bộ 1: Đặt khoảng cách giữa các đường tính bằng pip (mặc định: 100 pip)
- Màu Đường Bộ 1: Tùy chỉnh màu sắc của các đường (mặc định: tím)
- Độ Dày Đường Bộ 1: Đặt độ dày của các đường (mặc định: 1 pixel)
Đối với bộ đường thứ hai (liền)
- Số Đường Bộ 2: Xác định số đường vẽ phía trên và dưới giá hiện tại (mặc định: 2)
- Kích Thước Khoảng Cách Bộ 2: Đặt khoảng cách giữa các đường tính bằng pip (mặc định: 500 pip)
- Màu Đường Bộ 2: Tùy chỉnh màu sắc của các đường (mặc định: xanh lá)
- Độ Dày Đường Bộ 2: Đặt độ dày của các đường (mặc định: 1 pixel)
Sử Dụng Thực Tiễn
Thông thường, bộ đầu tiên (đường nét đứt) được dùng để xác định các mức tâm lý nhỏ hơn, trong khi bộ thứ hai (đường liền) làm nổi bật các mức tâm lý lớn hơn. Ví dụ, với EURUSD bạn có thể đặt bộ đầu tiên hiển thị các mức mỗi 100 pip (như 1.0800, 1.0900) và bộ thứ hai cho các mức mỗi 500 pip (như 1.0500, 1.1000).
Các mức này thường trùng với các vùng hỗ trợ hoặc kháng cự nơi giá có thể bật lại hoặc chậm lại trước khi tiếp tục di chuyển.
Round Number Levels - Indicator for cTrader
Description
This indicator draws horizontal lines at "round numbers" or psychologically significant levels on the chart. It's ideal for identifying potential support and resistance areas based on round price levels that often have psychological importance for traders.
Main Features
- Draws two distinct sets of horizontal lines at regular intervals
- Automatically calculates levels based on the current closing price
- Updates dynamically as price moves
- Offers separate configuration for each set of lines (color, style, size)
Possible Adjustments
For the first set of lines (dashed)
- Number of Lines Set 1: Determines how many lines to draw above and below the current price (default: 5)
- Range Size Set 1: Sets the distance between lines in pips (default: 100 pips)
- Line Color Set 1: Customizes the color of the lines (default: purple)
- Line Width Set 1: Sets the thickness of the lines (default: 1 pixel)
For the second set of lines (solid)
- Number of Lines Set 2: Determines how many lines to draw above and below the current price (default: 2)
- Range Size Set 2: Sets the distance between lines in pips (default: 500 pips)
- Line Color Set 2: Customizes the color of the lines (default: green)
- Line Width Set 2: Sets the thickness of the lines (default: 1 pixel)
Practical Usage
Typically, the first set (dashed lines) is used to identify minor psychological levels, while the second set (solid lines) highlights major psychological levels. For example, for EURUSD, you might set the first set to show levels every 100 pips (such as 1.0800, 1.0900) and the second set for levels every 500 pips (such as 1.0500, 1.1000).
These levels often coincide with support or resistance zones where price might bounce or slow down before continuing its movement.
Tóm tắt
Đánh giá của khách hàng
5 | 50 % | |
4 | 50 % | |
3 | 0 % | |
2 | 0 % | |
1 | 0 % |


![Logo "[Hamster-Coder] Moving Average MTF"](https://cdn.ctrader.com/image/webp/b11b98b1-194d-4b8e-b00e-d611826ad159_31226)


