
คำอธิบาย
การทำงานของตัวบ่งชี้ UTBot (ภาษาอิตาลี)
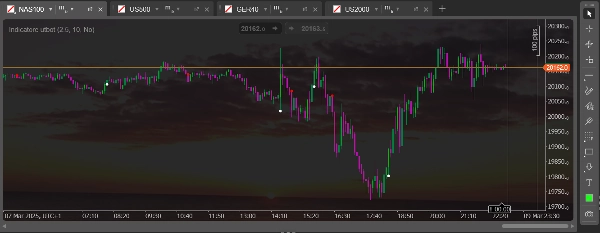
ตัวบ่งชี้ UTBot เป็นเครื่องมือวิเคราะห์ทางเทคนิคที่สร้างเส้นหยุดตามแบบไดนามิกโดยอิงจาก ATR คำนวณค่าหยุดโดยใช้ ATR คูณด้วยปัจจัยความไว สร้างแนวรับ/แนวต้านที่ปรับตามความผันผวน ระบุแนวโน้มขาขึ้นเมื่อราคายังคงอยู่เหนือเส้นนี้และแนวโน้มขาลงเมื่ออยู่ต่ำกว่า สร้างสัญญาณซื้อเมื่อราคาข้ามเส้นจากด้านล่างขึ้นด้านบน และสัญญาณขายเมื่อข้ามเส้นจากด้านบนลงด้านล่าง การตัดกันของ EMA กับเส้นหยุดตามแบบไดนามิกมักใช้เป็นการยืนยัน มีประสิทธิภาพในตลาดที่มีทิศทางและสำหรับการจัดการหยุดแบบไดนามิกสำหรับตำแหน่งที่เปิดอยู่
ฟังก์ชันตัวบ่งชี้ UTBot (ภาษาอังกฤษ)
ตัวบ่งชี้ UTBot เป็นเครื่องมือวิเคราะห์ทางเทคนิคที่สร้างเส้นหยุดตามแบบไดนามิกโดยอิงจาก ATR คำนวณค่าหยุดโดยใช้ ATR คูณด้วยปัจจัยความไว สร้างแนวรับ/แนวต้านที่ปรับตามความผันผวน ระบุแนวโน้มขาขึ้นเมื่อราคายังคงอยู่เหนือเส้นนี้และแนวโน้มขาลงเมื่ออยู่ต่ำกว่า สร้างสัญญาณซื้อเมื่อราคาข้ามเส้นจากด้านล่างขึ้นด้านบน และสัญญาณขายเมื่อข้ามเส้นจากด้านบนลงด้านล่าง การตัดกันของ EMA กับเส้นหยุดตามแบบไดนามิกมักใช้เป็นการยืนยัน มีประสิทธิภาพในตลาดที่มีทิศทางและสำหรับการจัดการหยุดแบบไดนามิกสำหรับตำแหน่งที่เปิดอยู่
สรุป
รีวิวจากลูกค้า
5 | 100 % | |
4 | 0 % | |
3 | 0 % | |
2 | 0 % | |
1 | 0 % |


