
Penerangan
Tahap Nombor Bulat - Penunjuk untuk cTrader
Penerangan
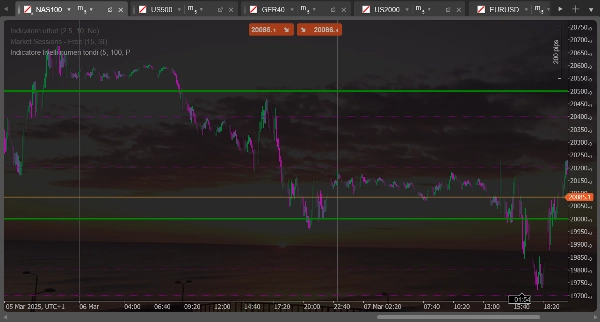
Penunjuk ini melukis garis mendatar pada "nombor bulat" atau tahap yang signifikan secara psikologi pada carta. Ia sesuai untuk mengenal pasti kawasan sokongan dan rintangan berpotensi berdasarkan tahap harga bulat yang sering mempunyai kepentingan psikologi untuk pedagang.
Ciri-ciri utama
- Melukis dua set garis mendatar yang berbeza pada selang tetap
- Mengira tahap secara automatik berdasarkan harga penutupan semasa
- Mengemas kini secara dinamik apabila harga bergerak
- Menawarkan konfigurasi berasingan untuk setiap set garis (warna, gaya, saiz)
Penyesuaian yang mungkin
Untuk set garis pertama (bergaris putus-putus)
- Bilangan Garis Set 1: Menentukan berapa banyak garis untuk dilukis di atas dan di bawah harga semasa (lalai: 5)
- Saiz Julat Set 1: Menetapkan jarak antara garis dalam pip (lalai: 100 pip)
- Warna Garis Set 1: Menyesuaikan warna garis (lalai: ungu)
- Lebar Garis Set 1: Menetapkan ketebalan garis (lalai: 1 piksel)
Untuk set garis kedua (padu)
- Bilangan Garis Set 2: Menentukan berapa banyak garis untuk dilukis di atas dan di bawah harga semasa (lalai: 2)
- Saiz Julat Set 2: Menetapkan jarak antara garis dalam pip (lalai: 500 pip)
- Warna Garis Set 2: Menyesuaikan warna garis (lalai: hijau)
- Lebar Garis Set 2: Menetapkan ketebalan garis (lalai: 1 piksel)
Penggunaan praktikal
Biasanya, set pertama (garis putus-putus) digunakan untuk mengenal pasti tahap psikologi kecil, manakala set kedua (garis padu) menonjolkan tahap psikologi utama. Sebagai contoh, untuk EURUSD anda mungkin menetapkan set pertama untuk menunjukkan tahap setiap 100 pip (seperti 1.0800, 1.0900) dan set kedua untuk tahap setiap 500 pip (seperti 1.0500, 1.1000).
Tahap-tahap ini sering bertepatan dengan zon sokongan atau rintangan di mana harga mungkin memantul atau melambat sebelum meneruskan pergerakannya.
Round Number Levels - Indicator for cTrader
Description
This indicator draws horizontal lines at "round numbers" or psychologically significant levels on the chart. It's ideal for identifying potential support and resistance areas based on round price levels that often have psychological importance for traders.
Main Features
- Draws two distinct sets of horizontal lines at regular intervals
- Automatically calculates levels based on the current closing price
- Updates dynamically as price moves
- Offers separate configuration for each set of lines (color, style, size)
Possible Adjustments
For the first set of lines (dashed)
- Number of Lines Set 1: Determines how many lines to draw above and below the current price (default: 5)
- Range Size Set 1: Sets the distance between lines in pips (default: 100 pips)
- Line Color Set 1: Customizes the color of the lines (default: purple)
- Line Width Set 1: Sets the thickness of the lines (default: 1 pixel)
For the second set of lines (solid)
- Number of Lines Set 2: Determines how many lines to draw above and below the current price (default: 2)
- Range Size Set 2: Sets the distance between lines in pips (default: 500 pips)
- Line Color Set 2: Customizes the color of the lines (default: green)
- Line Width Set 2: Sets the thickness of the lines (default: 1 pixel)
Practical Usage
Typically, the first set (dashed lines) is used to identify minor psychological levels, while the second set (solid lines) highlights major psychological levels. For example, for EURUSD, you might set the first set to show levels every 100 pips (such as 1.0800, 1.0900) and the second set for levels every 500 pips (such as 1.0500, 1.1000).
These levels often coincide with support or resistance zones where price might bounce or slow down before continuing its movement.
Ringkasan
Ulasan pelanggan
5 | 50 % | |
4 | 50 % | |
3 | 0 % | |
2 | 0 % | |
1 | 0 % |


