Descripción
Presentamos el mejorado Histograma MACD, diseñado para ofrecer una experiencia de trading más clara y perspicaz.
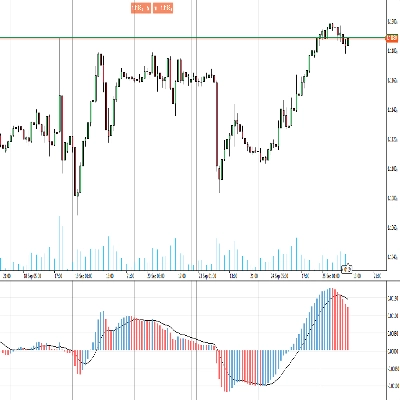
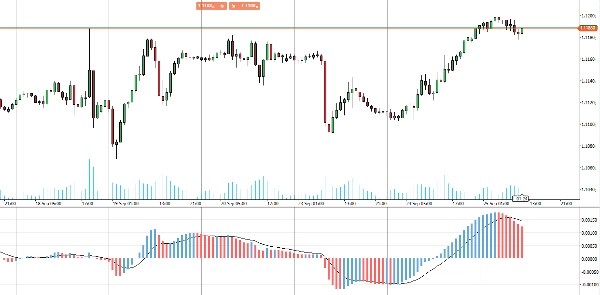
Este indicador mejorado muestra un histograma vibrante y colorido que diferencia entre cambios de precio alcistas y bajistas, yendo más allá del formato de un solo color predeterminado. Al usar colores distintos para movimientos positivos y negativos, ofrece una señal visual inmediata de las condiciones del mercado, facilitando la interpretación de cambios en el impulso y posibles reversiones de tendencia.
Perfecto para traders que buscan mayor claridad y precisión, esta mejora del Histograma MACD transforma tu gráfico en una herramienta analítica más potente. Eleva tu estrategia de trading con el mejorado Histograma MACD.
Resumen
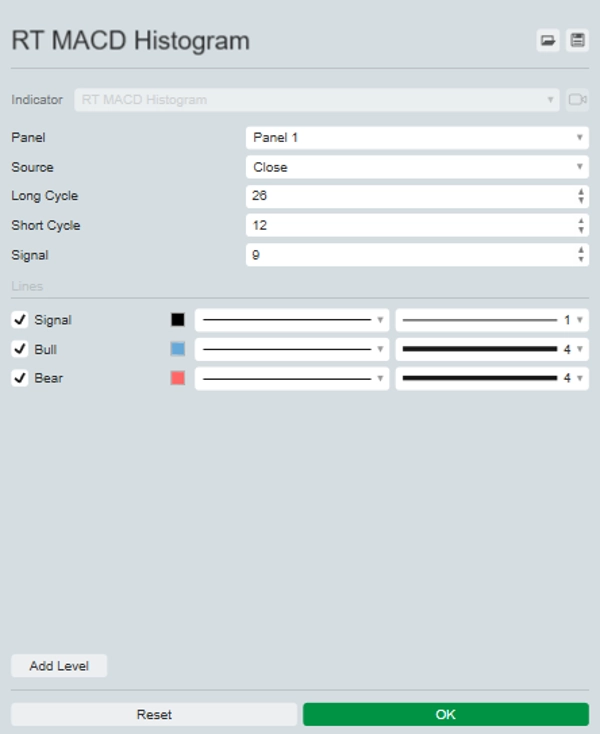
Perfil del indicador
Valoraciones de clientes
0.0
Valoraciones: 0
Valoraciones de clientes
Este producto todavía no se ha valorado. ¿Ya lo ha probado? Sea el primero en informar a otros.
Conversación
Preguntas frecuentes
BTCUSD
Forex
Signal
Indices
EURUSD
Commodities
GBPUSD
NZDUSD
Prop
Scalping
Crypto
Stocks
XAUUSD
NAS100
MACD
USDJPY
Los productos disponibles a través de cTrader Store, incluidos bots, indicadores y plugins para operar, son proporcionados por desarrolladores de terceros y están disponibles únicamente con fines informativos y de acceso técnico. cTrader Store no es un bróker, por lo que no proporciona asesoramiento de inversión, recomendaciones personales ni ninguna garantía de rentabilidad futura.


![Logotipo de "Gaussian Channel [Iridio Capital]"](https://cdn.ctrader.com/image/webp/7c039209-5573-4a54-a072-f9528b503103_41960)


![Logotipo de "[Stellar Strategies] Market Session Ultimate"](https://cdn.ctrader.com/image/webp/61ffd537-0125-4246-9e72-42eca1791d64_28232)


Precio
Desde 25/09/2024
20
Ventas