NNFX TP AND SL V1.1
مؤشر
الإصدار 1.0، Apr 2025
Windows, Mac
5.0
التقييمات: 1

الوصف
🔹 ما الذي يفعله
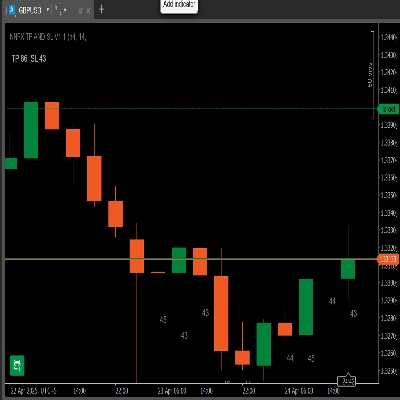
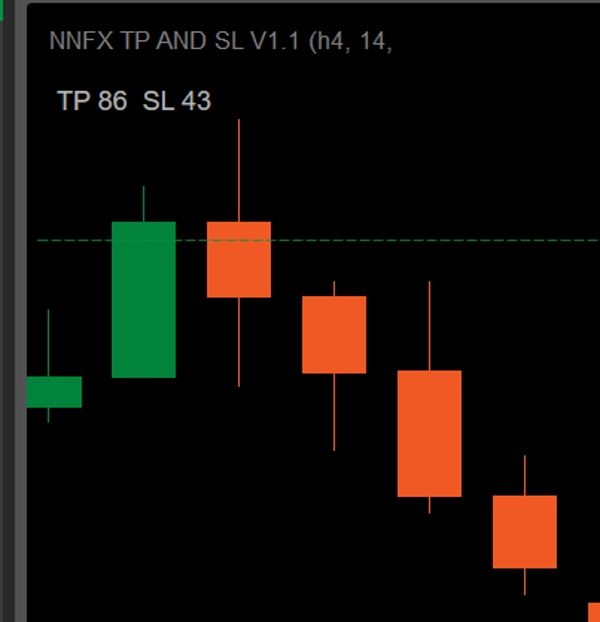
- لوحة ديناميكية: تعرض "TP × SL" بالنقاط بناءً على فترة ATR المختارة ومضاعف TP.
- تسميات ATR لآخر 10 أشرطة: تطبع ATR بالنقاط تحت كل من الشموع العشر الأخيرة (على نفس الإطار الزمني).
- التحقق من الإطار الزمني: إذا قمت بإرفاقه على إطار زمني مختلف للرسم البياني، فإنه يحذر "الأطر الزمنية لا تتطابق – ATR غير معروضة على الأشرطة."
🔹 الميزات الرئيسية
- عرض اللوحة
-
- TP = ATR × المضاعف الخاص بك (اختر من 1 ÷ 4.5 بخطوات 0.5)
- SL = ATR بالنقاط
- مثال: ATR = 43 → SL = 43 نقطة. إذا كان المضاعف = 2 → TP = 86 نقطة.
- تسميات ATR لكل شريط
-
- تحتوي الأشرطة العشرة الأخيرة على قيم ATR الخاصة بها بالنقاط.
- يبقيك على علم فوري بالتقلبات الأخيرة.
- التحقق من الإطار الزمني
-
- يرسم التسميات فقط عندما يتطابق إطار الرسم البياني الزمني مع إعداد إطار ATR الخاص بك.
- وإلا يظهر تحذير أحمر في الأسفل.
- تصفية القمم (اختياري)
-
- تمكين مرشح المتوسط + k·σ لتثبيت أشرطة الانهيار السريع.
- مضاعف σ قابل للتكوين.
🔹 كيفية التثبيت والاستخدام
- تحميل
NNFXATRInfoIndicator_v1.1.algo. - في cTrader → Algo → Indicators، انقر على استيراد مؤشر واختر ملف
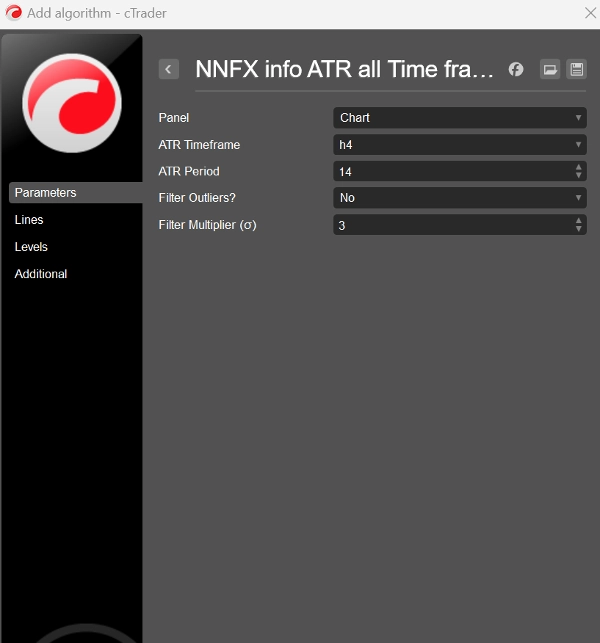
.algo. - أضف إلى الرسم البياني وافتح تبويب المعلمات:
-
- إطار ATR الزمني: مثلاً H4
- فترة ATR: الافتراضية 14
- مضاعف TP: 1 – 4.5
- هل تستخدم مرشح القمم؟: نعم/لا
- مضاعف الفلتر σ: الافتراضي 3
- انقر على أضف إلى الرسم البياني. سترى لوحة "TP × SL" في الأعلى يساراً وتسميات ATR لآخر 10 أشرطة تظهر تلقائياً (إذا تطابقت الأطر الزمنية).
🔹 لماذا ستحبه
- صفر حسابات: لا مزيد من تحويلات الأعداد العشرية إلى نقاط—كل شيء بالنقاط الكاملة.
- جاهز لـ NNFX: حجم SL و TP مطابق تمامًا لقواعد ATR في نظامك. فقط اختر الإطار الزمني و اتجاه التداول الذي تريد التداول به—ثم ببساطة اضبط مضاعف TP ليناسب نسبة المخاطرة إلى المكافأة المفضلة لديك.
- واضح ونظيف: كل معلومات التقلب في طبقة واحدة مدمجة—لا نوافذ إضافية.
- مرن للغاية: أي زوج فوركس، أي إطار زمني، قابل للتخصيص بالكامل.
- عزز دخولات NNFX الخاصة بك بتوقفات وأهداف دقيقة مبنية على ATR!
الملخص
ملف تعريف المؤشر
تقييمات العملاء
5.0
التقييمات: 1
5 | 100 % | |
4 | 0 % | |
3 | 0 % | |
2 | 0 % | |
1 | 0 % |
تقييمات العملاء
May 3, 2025
the first test should keep DD under 3 percent, and the trade idea gets a pause before execution.
مناقشة
الأسئلة الشائعة
ATR
يتم توفير المنتجات المتاحة من خلال cTrader Store، بما في ذلك روبوتات التداول والمؤشرات والإضافات، من قبل مطوري الطرف الثالث وإتاحتها لأغراض الوصول المعلوماتي والفني فقط. cTrader Store ليس وسيطًا ولا يقدم نصائح استثمارية أو توصيات شخصية أو أي ضمان للأداء المستقبلي.


السعر
منذ 24/04/2025
27.69M
حجم التداول
629.04K
الربح بالبيب