
Vice TrendTrading
Indicatore
Versione 1.0, Jul 2025
Windows, Mac
4.5
Recensioni: 2
Descrizione
Vice TrendTrading
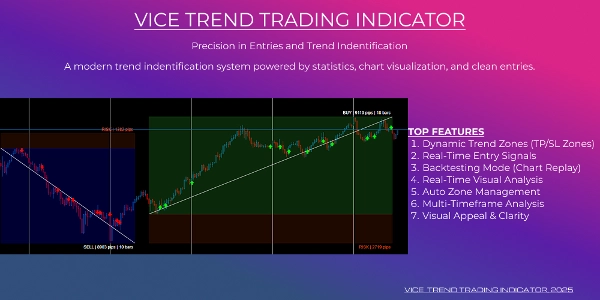
"Zone di tendenza avanzate e frecce di ingresso di precisione alimentate dalla logica di tendenza multi-timeframe"
Non è solo un altro indicatore di tendenza — è un sistema di trading visivo completo progettato per aiutarti a trovare la tendenza del mercato, monitorare le prestazioni del mercato in tempo reale, e analizzare i risultati della tendenza con chiarezza.
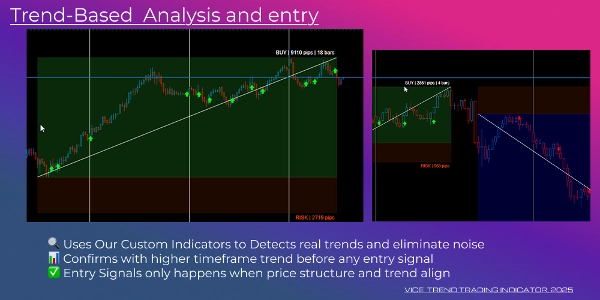
Questo strumento avanzato combina analisi della tendenza multi-timeframe, sovrapposizioni di profitto/perdita in tempo reale, e frecce di segnale automatiche in un'esperienza grafica pulita e potente.
Caratteristiche principali:
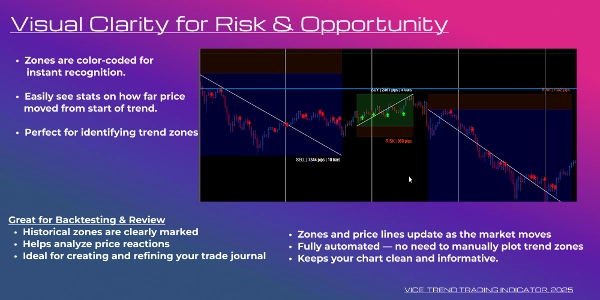
1. Zone di tendenza dinamiche (visualizzazioni TP/SL)
Riepilogo
Profilo indicatore
Recensioni dei clienti
4.5
Recensioni: 2
5 | 50 % | |
4 | 50 % | |
3 | 0 % | |
2 | 0 % | |
1 | 0 % |
Recensioni dei clienti
July 15, 2025
not perfect, but the workflow felt cleaner, and A small account test feels safer.
July 7, 2025
Not perfect, but the workflow felt cleaner. It needs a few bad trades in the sample too.
Discussioni
Domande frequenti
I prodotti disponibili tramite cTrader Store, inclusi bot di trading, indicatori e plugin, sono forniti da sviluppatori terzi e resi disponibili esclusivamente a scopo informativo e di accesso tecnico. cTrader Store non è un broker e non fornisce consulenze in materia di investimento, raccomandazioni individualizzate o garanzie di risultati futuri.


Prezzo
Da 17/06/2025