说明
The SmartADXWMAIndicator 是一个多功能的技术分析自定义工具。它结合了两个核心组件,帮助交易者识别和跟踪市场趋势:
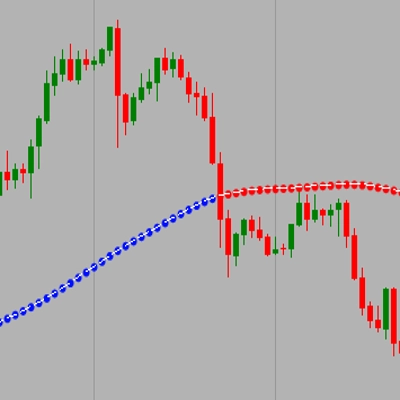
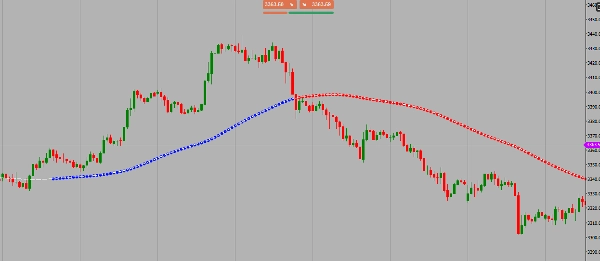
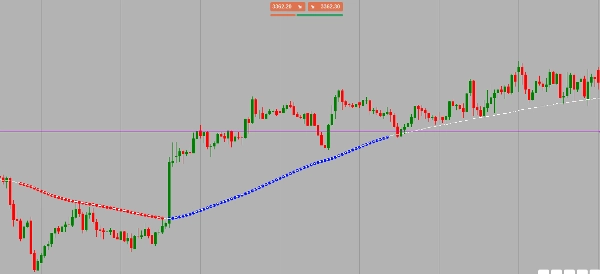
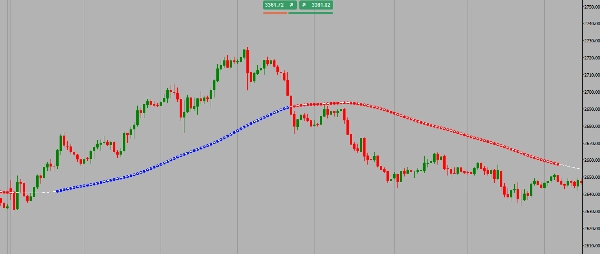
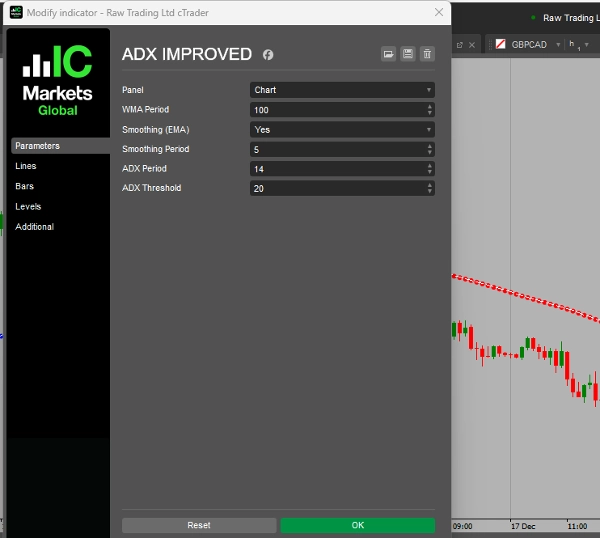
- 平滑趋势线:指标计算收盘价的 加权移动平均线 (WMA)。然后对该 WMA 应用 指数移动平均线 (EMA),在图表上创建一条单一且平滑的线。这条线设计为对近期价格动作高度敏感,同时过滤掉小幅波动,清晰地展示当前趋势的方向。
- 趋势确认信号点:它使用 平均方向指数 (ADX),一种高级动量指标,来确认趋势的强度。当 ADX 值超过用户定义的阈值时,表示市场处于强劲且持续的趋势中。
协同工作方式
该指标的强大之处在于其综合方法。它不仅显示趋势线,还提供精确的视觉信号。
- 当 ADX 超过阈值且 价格高于趋势线时,趋势线上会出现一个 绿色点,确认强烈的看涨趋势。
- 当 ADX 超过阈值且 价格低于趋势线时,会出现一个 红色点,确认强烈的看跌趋势。
这种组合使交易者能够轻松识别市场趋势、趋势方向,以及基于价格与趋势线的关系,何时可能考虑进场或出场交易。
对于波段交易,你可以尝试 wma 100 和阈值 20 或 25。
摘要
指标配置
客户评价
0.0
评价:0
客户评价
该产品尚无评价。已经试过了?抢先告诉其他人!
讨论
常见问答
cTrader Store 提供的所有产品,包括交易机器人、指标和插件,均由第三方开发者提供,仅供信息参考和技术访问之用。cTrader Store 并非经纪商,不提供投资建议、个人推荐或任何未来业绩保证。


价格
注册日期 15/12/2024
3.6M
交易量
2.05M
盈利点数