
ADX and ADI
指标
258 下载
版本 1.0, Aug 2025
Windows 版、Mac 版
5.0
评价:2
说明
主要特点:
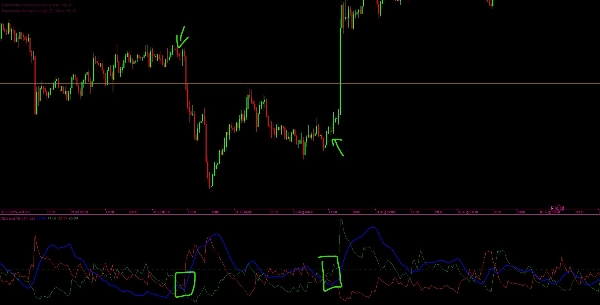
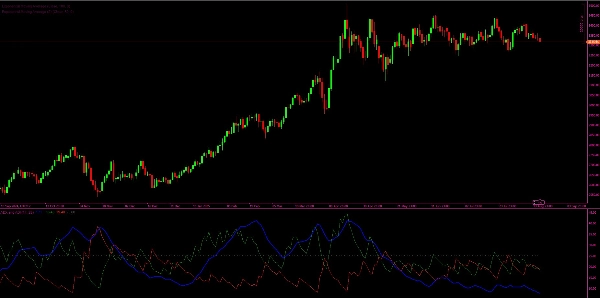
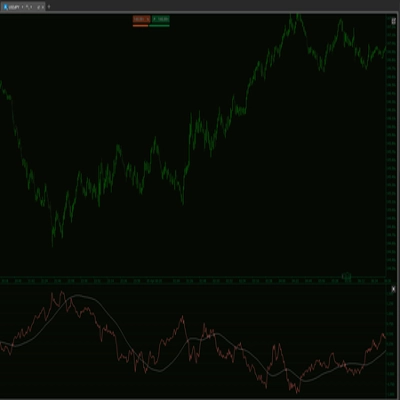
- ADX 和 ADI 线(蓝色): 显示当前趋势的平滑强度,无论方向如何。
- +DI 线(绿色): 表示上升运动的强度。
- -DI 线(红色): 表示下降运动的强度。
- 阈值线(灰色): 一个水平参考线(默认25),用于帮助识别趋势强度是否显著。
工作原理:
- 指标计算了 真实波幅(TR),正向方向移动(+DM),和 负向方向移动(-DM)。
- 它应用了 Wilder 的平滑技术 来计算 TR、+DM 和 -DM 的平滑值。
- 从中得出 方向指标(+DI 和 -DI),显示哪一方(多头或空头)具有更强的动能。
- 通过 +DI 和 -DI 之间的相对差异计算出 DX(方向指数)。
- 最后,计算出 ADX(平均方向指数),作为 DX 的平滑版本,提供整体 趋势强度 的度量。
解读:
- 当 ADX 高于阈值(例如25) 时,市场被认为处于强趋势状态。
- 当 +DI > -DI 时,多头占优(上升趋势)。
- 当 -DI > +DI 时,空头占优(下降趋势)。
- 当 ADX 低于阈值 时,市场被认为处于盘整状态(趋势弱或无趋势)。
摘要
指标配置
客户评价
5.0
评价:2
5 | 100 % | |
4 | 0 % | |
3 | 0 % | |
2 | 0 % | |
1 | 0 % |
客户评价
December 1, 2025
ADX and ADI delivers clean trend strength and direction signals. ADX shows when the market is actually trending, while +DI and -DI reveal who’s in control. Stable, lightweight and reliable across all timeframes. Best on H1+ for smoother signals. Alerts and zone-highlighting would be great additions.
September 12, 2025
讨论
常见问答
cTrader Store 提供的所有产品,包括交易机器人、指标和插件,均由第三方开发者提供,仅供信息参考和技术访问之用。cTrader Store 并非经纪商,不提供投资建议、个人推荐或任何未来业绩保证。


价格
注册日期 21/02/2025
466.3M
交易量
180.83K
盈利点数
22
销售
6.79K
免费安装