present
Sign up and get $50 off your first purchase
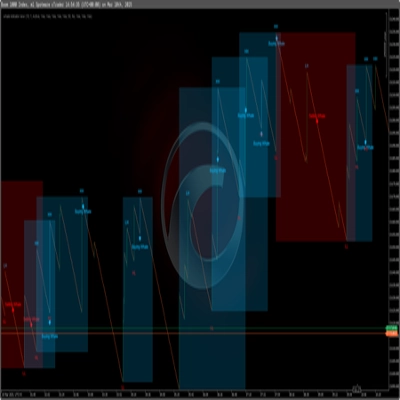
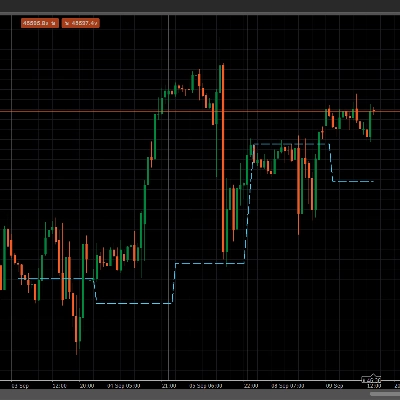
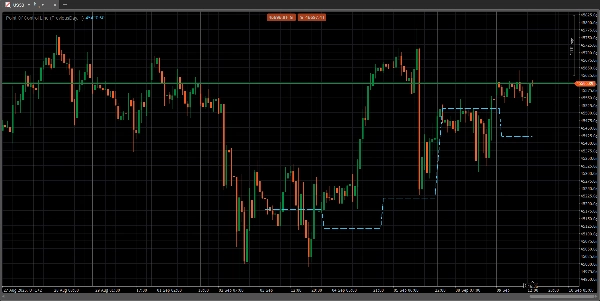
Trading product for POC session line_noSourceCode Indicator Forex Indices, image 1
POC session line_noSourceCode
Indicator
Version 1.0, Sep 2025
Windows, Mac
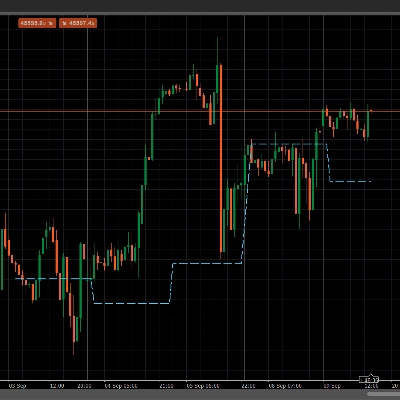
Trading product for POC session line_noSourceCode Indicator Forex Indices, image 2
Since 21/04/2025

Description

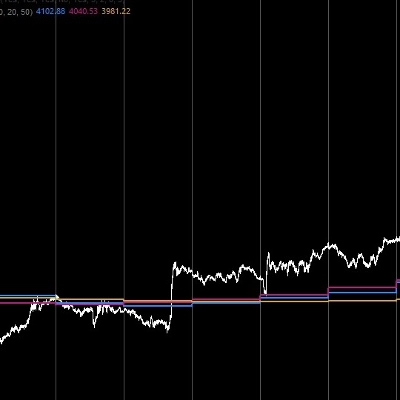
The Point of Control (POC) is a price level on a volume profile chart where the most trading volume has been conducted within a specified period. This level acts as a significant support or resistance zone because it represents a price where large trading institutions were most active and where market price found consensus. Traders use the POC to identify key price zones, gauge market sentiment, and anticipate potential price movements and reversals

Summary

AI summary
The POC session line indicator displays the Point of Control (POC) from previous trading sessions on a volume profile chart. The POC represents the price level where the highest volume of trades occurred during a specified period. This level is significant as it often acts as a support or resistance zone, reflecting where major market participants were most active and where price consensus was reached. Traders use this indicator to identify key price zones, assess market sentiment, and anticipate potential price movements or reversals. It supports analysis across markets such as Forex and Indices.
Indicator profile

Customer reviews

0.0
Reviews: 0
Customer reviews
No reviews for this product yet. Already tried it? Be the first to tell others!

Discussion

FAQ

Forex
Indices
Products available through cTrader Store, including trading bots, indicators and plugins, are provided by third-party developers and made available for informational and technical access purposes only. cTrader Store is not a broker and does not provide investment advice, personal recommendations or any guarantee of future performance.

More from this author
Indicator
Forex
Indices
Displays the POC line for previous sessions in an easy to see manner.

You may also like

Indicator
Channel
Imbalance
+2
Adaptive volatility channel based on moving average and standard deviation (σ).
Indicator
Doji
Volume
+5
Instantly spot high-liquidity institutional moves with clean, non-obtrusive triangle alerts on cTrader charts.
Indicator
SMC
Prop
+15
Automatic Elliott Wave Detection with Professional Filters
"rvwap v1" logo
Top-rated
4.6
(5)
$19
Indicator
Prop
VWAP
+13
Rolling VWAP with dynamic or fixed time window, customizable source price and standard deviation bands.
Indicator
ATR
RSI
+24
Daily moving averages, simplified. Displays 3 daily moving averages on lower timeframes with selectable MA types.
Indicator
BOS
MSS
+5
Your entire ICT session map, structure engine, and key levels — No manual work. One indicator. Every session!
Indicator
AI
Forex
+5
Whale Hunting Indicator
Indicator
Prop
Forex
+11
⚡Nebula Range Filter is a professional trend filter indicator for cTrader⚡
Indicator
ATR
RSI
+7
Identify bullish and bearish Order Blocks to spot key support/resistance levels and potential trend reversals! 📈🔄
Indicator
This indicator can be used to: change color, shape size, position, change font, increase or decrease, and other function
Indicator
RSI
RSI on the main chart with 45/55 momentum levels, overbought/oversold levels, averaged RSI, and multi-timeframe support.
Indicator
Prop
Forex
+11
🌊 See when the market is truly in play. Tsunami measures Relative Volume by time-of-day 🌊
Indicator
AI
ATR
+26
SMC without the mess: Clean structure + auto-managing FVGs + MTF panel. Hard-right-edge, step size-based for any symbol.
Indicator
AI
Grid
+17
Clean 3D, Sleek Candles for Trend Patterns.
Indicator
AI
SMC
+5
Coloring trendline/ Colored Trendline / Color Trendline
Indicator
ZLSMA: Zero-lag trend indicator! Catch trends fast with customizable settings. Boost your trading precision.
Indicator
Forex
Crypto
+2
Market Structure Indicator – Your Trading Map in a Noisy Market. No more Panicking Which one, Where, Why and How.
Indicator
RSI
Stochastic
+2
Composite mean-reversion oscillator merging Z-Score, RSI & Bollinger %B into one clear overbought/oversold signal.

Price

Since 21/04/2025