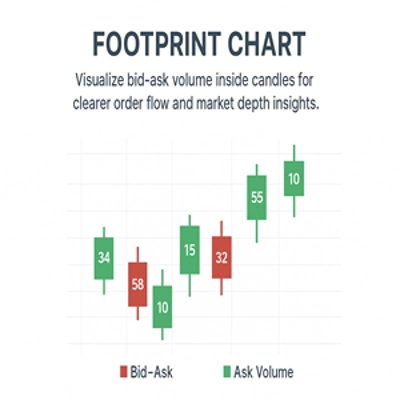
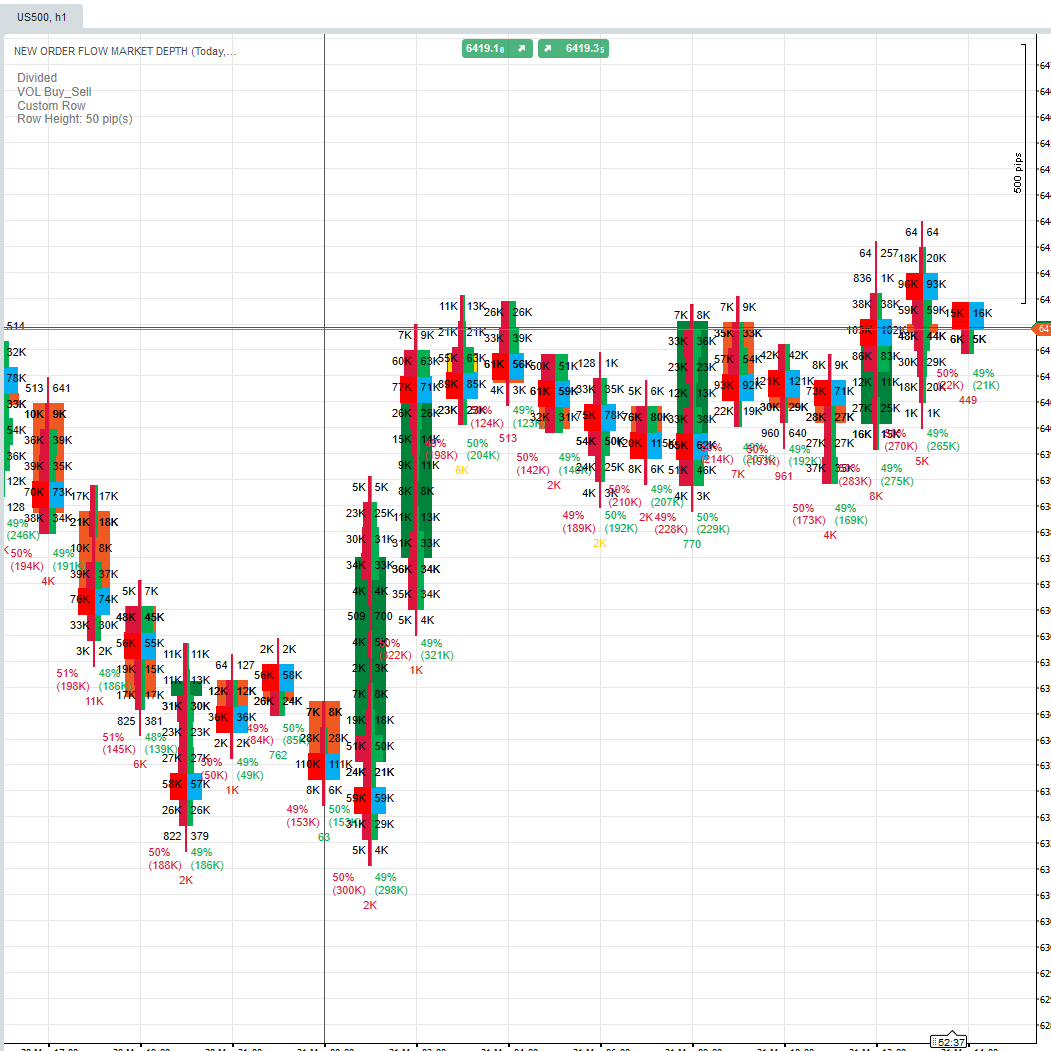
footprint Chart Indicator
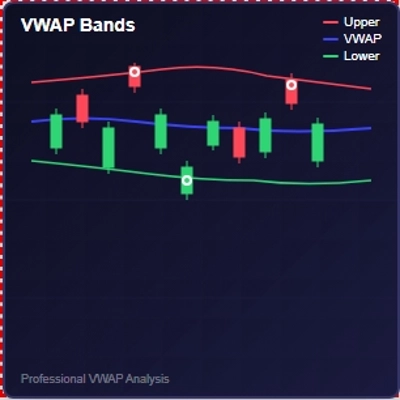
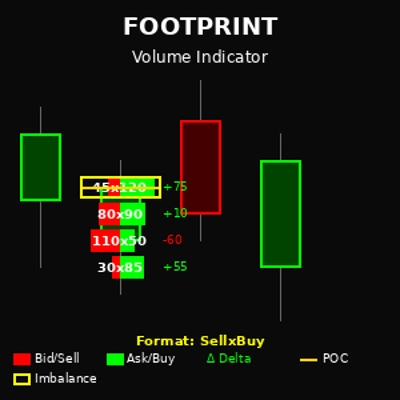
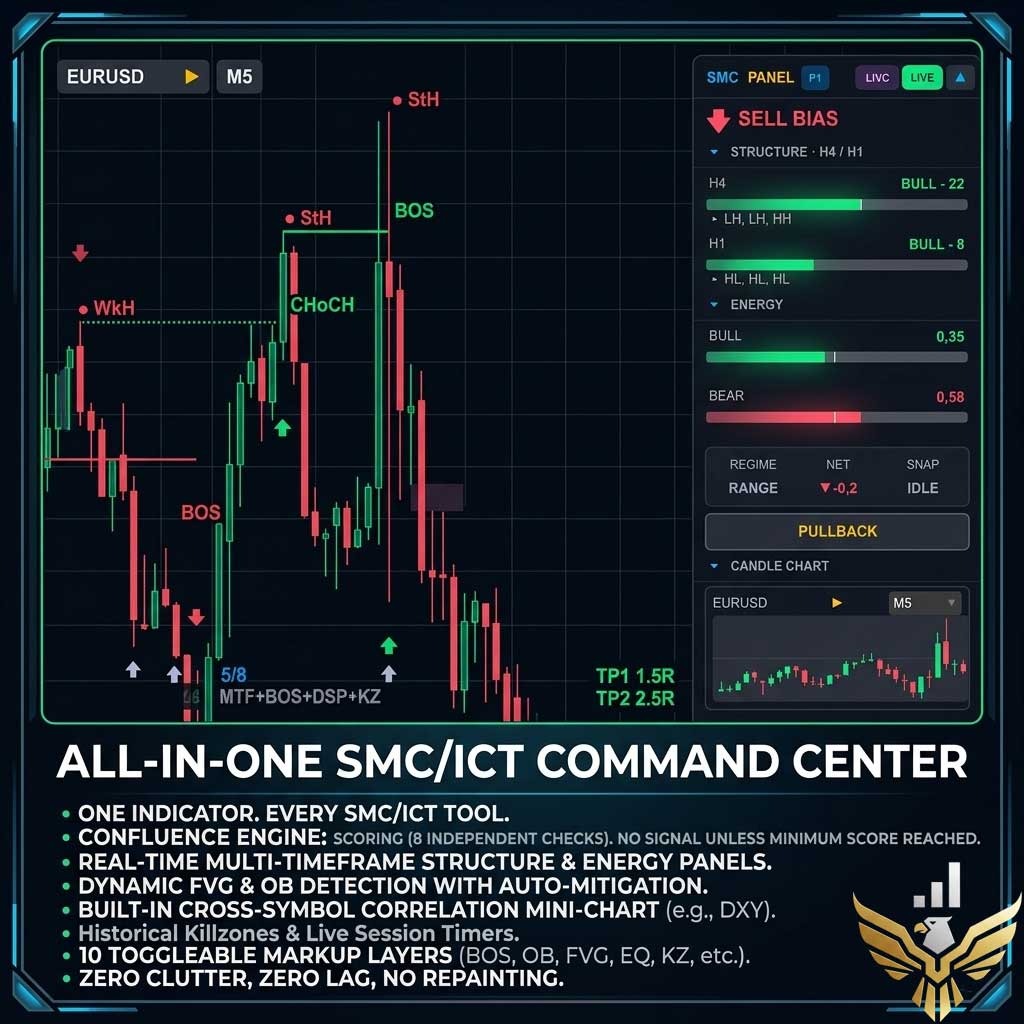
The Footprint Chart Indicator provides traders with a detailed view of order flow by displaying bid and ask volume directly inside each price candle. Unlike traditional candlestick charts, this tool allows users to see where buying and selling pressure is concentrated at specific price levels. By highlighting imbalances between buyers and sellers, it offers deeper insights into market depth, liquidity, and trading activity. This makes it an essential tool for traders seeking to refine entries, exits, and risk management through advanced order flow analysis.
Indicator profile
0.0
评价:0
客户评价
该产品尚无评价。已经试过了?抢先告诉其他人!
NAS100
NZDUSD
XAUUSD
Commodities
Forex
Signal
EURUSD
GBPUSD
BTCUSD
Indices
Prop
Stocks
Crypto
USDJPY
Scalping
Products available through cTrader Store, including indicators, plugins and cBots, are provided by third-party developers and made available for informational and technical access purposes only. cTrader Store is not a broker and does not provide investment advice, personal recommendations or any guarantee of future performance.
该作者的其他作品


猜您喜欢


注册日期 15/01/2025
6
销售