
Institutional Volume Supply Demand
指标
1.51K 下载
版本 1.0, Sep 2025
Windows 版、Mac 版
4.4
评价:5
说明
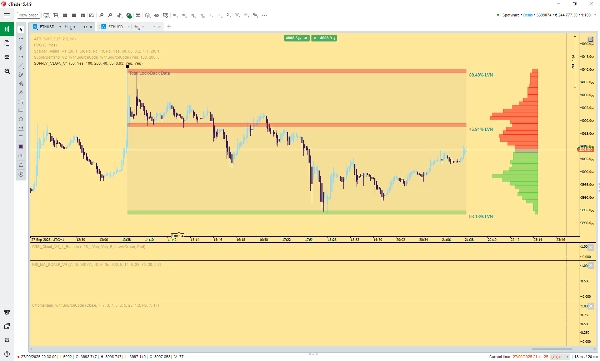
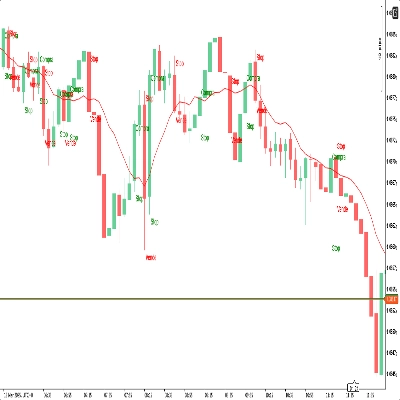
成交量轮廓区(供需)
该 成交量轮廓区 指标通过利用 价格成交量 分析,提供机构级别的市场结构视图。它自动识别基于市场低效和流动性空缺的高概率支撑和阻力水平。
主要特点:
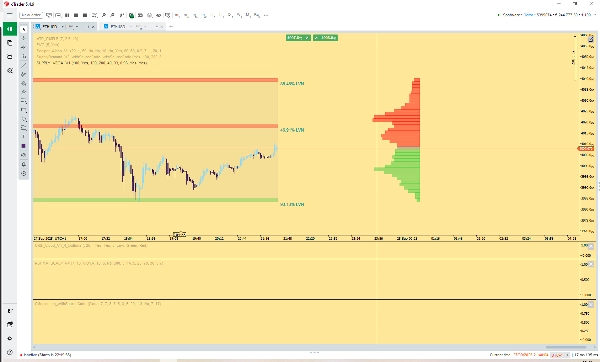
- 机构级支撑与阻力(LVNs): 自动计算并标记 低成交量节点(LVNs)——价格快速移动且成交量极低的区域。这些LVNs作为未来高确信度的供给(阻力)和需求(支撑)区。
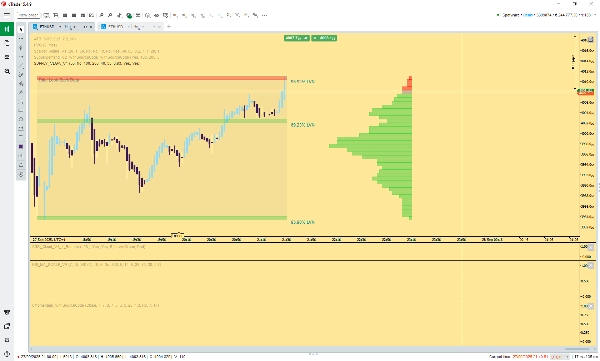
- 动态回溯: 该轮廓自动调整其分析周期,仅聚焦当前主要波动或趋势,在重大市场转折后重置。
- 价格相关着色: 可见的成交量轮廓直方图及相应的供需区根据当前价格动态着色:
-
- 绿色: 当前价格下方的成交量区域(作为需求/支撑)。
- 红色: 当前价格上方的成交量区域(作为供给/阻力)。
- LVN强度: 区域标注有百分比,表示该水平成交量的弱度,提供该区域理论强度(流动性空缺大小)的客观衡量。
该工具对于利用高级市场结构、订单流或成交量轮廓技术识别关键兴趣点并预测市场转折的交易者至关重要。
摘要
AI 摘要
The Institutional Volume Supply Demand indicator offers an advanced market structure analysis using Volume Profile Zones based on Volume at Price data. It automatically identifies key Support and Resistance levels by detecting Low Volume Nodes (LVNs), which represent areas where price moved rapidly with minimal trading volume, indicating potential future supply (resistance) and demand (support) zones. The indicator dynamically adjusts its look-back period to focus on the current major swing or trend, resetting after significant market pivots. It visually distinguishes supply and demand zones with color coding: green for volume areas below the current price (demand/support) and red for areas above (supply/resistance). Each LVN is labeled with a percentage that quantifies the weakness of volume at that level, providing an objective measure of zone strength based on liquidity void size. This tool supports traders employing advanced techniques such as order flow and Volume Profile analysis to identify high-probability market turning points. It is applicable across various markets including Forex pairs (e.g., EURUSD, GBPUSD, NZDUSD, USDJPY), cryptocurrencies (BTCUSD), indices (NAS100), and commodities (XAUUSD).
指标配置
客户评价
4.4
评价:5
5 | 80 % | |
4 | 0 % | |
3 | 0 % | |
2 | 20 % | |
1 | 0 % |
客户评价
May 15, 2026
CTrader's recent update has made this indicator obsolete. It simply stops CTrader from working. this Indicator needs an update to correlate with the Ctrader update.
April 8, 2026
November 3, 2025
Excelente indicador para quem opera baseado em zonas de liquidez, oferta e demanda institucional. Ótimo trabalho!
讨论
常见问答
BTCUSD
Forex
Signal
Breakout
EURUSD
GBPUSD
NZDUSD
Bollinger
Fibonacci
ZigZag
Scalping
Fair Value Gap
SMC
Grid
AI
XAUUSD
NAS100
MACD
USDJPY
VWAP
cTrader Store 提供的所有产品,包括交易机器人、指标和插件,均由第三方开发者提供,仅供信息参考和技术访问之用。cTrader Store 并非经纪商,不提供投资建议、个人推荐或任何未来业绩保证。


价格
注册日期 09/01/2025
11.78K
免费安装