
说明
每日TPO轮廓
每日TPO轮廓指标,计算每个交易时段的POC、VAH和VAL。
直接在图表上绘制控制点和70%的价值区,帮助您识别公平价值区、关键支撑/阻力位以及潜在的价格拒绝或接受区域。
工作原理
该指标构建了一个每日TPO(时间价格机会)轮廓,类似于市场轮廓。
对于交易日的每个柱线,它:
- 将价格轴分割成由“行大小(点差)”定义的固定“步长”
- 对于每个价格步长,计算触及该水平的柱线数量(TPO = 价格在该处交易的次数)
- 在当天结束时计算:
-
- POC(控制点) → 具有最高TPO数量的价格水平(市场停留时间最长的地方)
- VAH(价值区高点) 和 VAL(价值区低点) → 包含该时段大约价值区百分比(默认70%)的所有TPO的价格水平
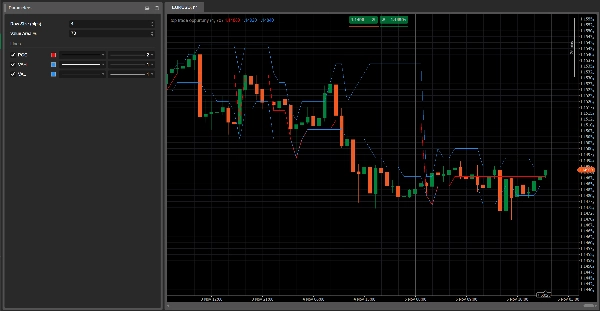
该指标在图表上绘制三条水平线:
- 红线 → POC
- 蓝线 → VAH(上方)和VAL(下方)
这些线在交易时段内逐柱更新,并在新交易日开始时重置。
主要参数
行大小(点差)
定义轮廓中每个价格步长的厚度。-
- 较小的值 = 更详细的轮廓
- 较大的值 = 更平滑的轮廓
价值区百分比
价值区内包含的总TPO百分比(通常为70%)。
价值区是当天市场活动最集中的价格区域。
如何解读
- POC(红线)
-
- 当天市场最“接受”的价格水平。
- 通常作为平衡水平:价格可能在该区域反弹、停滞或强力突破。
- 价值区(VAH–VAL,蓝线)
-
- 代表大多数交易发生的“公平价值”区域。
- 相对于VAH/VAL的价格行为可以显示:
-
- 极端价格的拒绝(VAH/VAL之外的假突破)
- 新价格的接受(价值区外的盘整)
典型使用思路
- 价格拒绝VAL并回到价值区内 → 潜在多头思路,押注回归“公平价值”(均值回归)。
- 价格强势突破VAH并开始在上方构建结构 → 潜在的新高价值区开始(趋势跟随情景)。
- 多日POC集中在同一水平 → 强平衡/积累区,通常是关键支撑/阻力。
摘要
AI 摘要
The Daily TPO Profile indicator constructs a daily Time Price Opportunity (TPO) profile similar to a Market Profile, analyzing market activity by price levels throughout each trading session. It divides the price axis into fixed increments ("Row Size" in pips) and counts how many bars traded at each price step, representing TPOs. At the end of the session, it calculates three key levels: the Point of Control (POC), where the market spent the most time; the Value Area High (VAH); and the Value Area Low (VAL), which together define the price range containing approximately 70% of the trading activity.
The indicator plots these levels as horizontal lines on the chart—POC in red, VAH and VAL in blue—updating them bar by bar during the session and resetting daily. Traders use the POC as an equilibrium price level that may act as support or resistance. The Value Area highlights fair value zones, with price action near VAH and VAL signaling potential rejection or acceptance of price extremes. Typical applications include identifying mean reversion opportunities when price rejects VAL or trend-following setups when price breaks above VAH.
Main adjustable parameters include Row Size (pips), controlling profile detail, and Value Area %, defining the percentage of TPOs included in the value area. The indicator supports analysis across various markets including forex, indices, commodities, stocks, and cryptocurrencies.
指标配置
客户评价
0.0
评价:0
客户评价
该产品尚无评价。已经试过了?抢先告诉其他人!
讨论
常见问答
Signal
Indices
Commodities
GBPUSD
RSI
Bollinger
Fibonacci
Scalping
AI
XAUUSD
NAS100
MACD
BTCUSD
Forex
Breakout
EURUSD
NZDUSD
Martingale
Prop
ZigZag
Supertrend
Fair Value Gap
SMC
Crypto
Grid
Stocks
ATR
USDJPY
VWAP
cTrader Store 提供的所有产品,包括交易机器人、指标和插件,均由第三方开发者提供,仅供信息参考和技术访问之用。cTrader Store 并非经纪商,不提供投资建议、个人推荐或任何未来业绩保证。


价格
42.11M
交易量
6.13M
盈利点数
222
销售
8.39K
免费安装