
说明
您可以通过此链接购买围绕该指标及另外两个指标设计的cBot:https://ctrader.com/it/products/1056?u=Labot
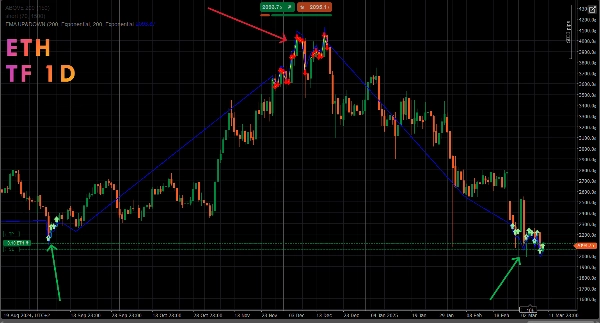
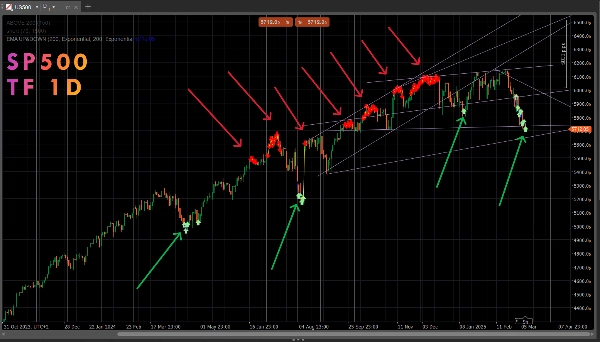
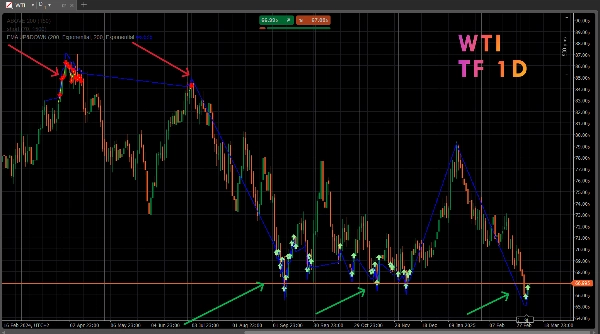
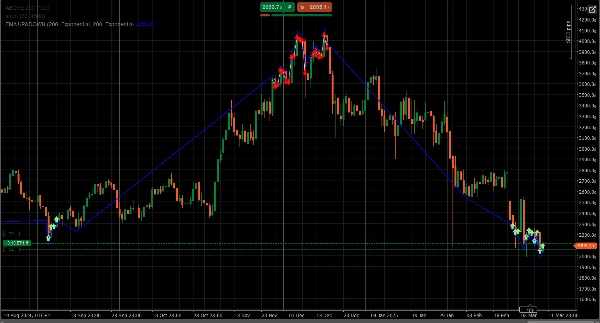
SectorIndex Dual Moving Average Indicator 是一个卓越的交易工具,适合寻求准确信号 🎯 以及利用市场波动 📉📈 的能力的交易者。该指标利用两个移动平均线——一个短期和一个长期——结合了简单性和强大功能 💪,适用于任何资产和时间框架。
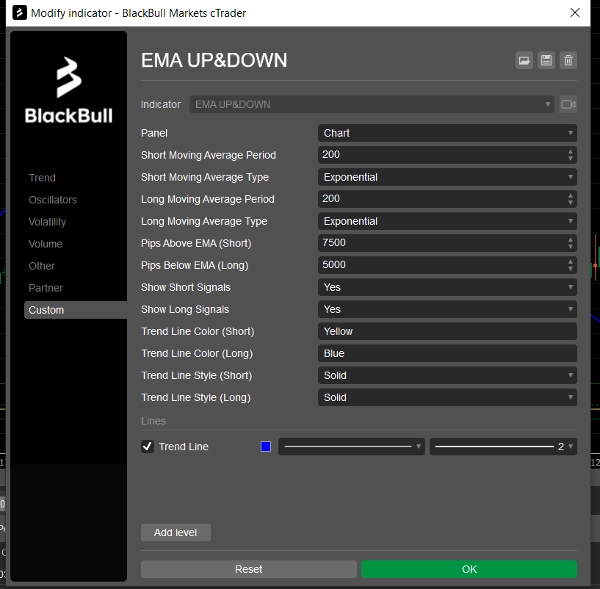
通过可配置参数以适应各种市场和资产,您可以根据价格相对于移动平均线的条件获得精准的 多头 和 空头 信号。该指标不仅绘制线条,还添加了动态趋势线 🔄、清晰的视觉信号(空头用向下箭头 ⬇️,多头用向上箭头 ⬆️),并支持线条颜色 🎨 和样式等自定义。
该指标不仅是自由裁量交易者的宝贵工具,还是 多个自动交易机器人 的技术基础,这些机器人已开发完成并在本店销售。得益于 SectorIndex Dual MA Indicator 的准确性和灵活性,基于它构建的机器人为算法交易提供了卓越的洞察,针对各种资产和策略进行了优化。
🔥 优点:
- 适应所有时间框架和资产 ⏱️。
- 精准且清晰的信号,图表上有视觉支持 👀。
- 完全可配置:平均线上下的点数、样式和颜色 ✨。
- 适合趋势跟踪或逆势策略的优秀工具 📊。
- 开发自动机器人技术基础 🤖。
⚠️ 风险:必须牢记交易存在风险 ⚠️。无论多么强大的指标,都无法保证盈利 💸。请始终使用适当的风险管理 🛡️ 并在模拟账户上测试指标 🧪,然后再用真钱应用。
您可以通过此链接购买围绕该指标及另外两个指标设计的cBot:https://ctrader.com/it/products/1056?u=Labot
摘要
AI 摘要
The EMA UP&DOWN 2025, also known as the SectorIndex Dual Moving Average Indicator, is a technical analysis tool that uses two moving averages—a short and a long period—to generate trading signals. It provides clear LONG and SHORT signals based on price movements relative to these averages, enhanced by dynamic trend lines and visual cues such as up and down arrows. The indicator is fully configurable, allowing users to adjust parameters like the distance in pips from the averages, line color, and style to suit various assets and timeframes.
Designed for adaptability, it supports multiple markets including Forex, cryptocurrencies, commodities, indices, and stocks. It serves both discretionary traders seeking precise entry signals and developers as a technical foundation for automated trading bots. These bots leverage the indicator’s accuracy and flexibility for algorithmic strategies optimized across different assets.
Key features include compatibility with all timeframes and assets, clear visual signals on charts, and extensive customization options. The indicator is suitable for trend-following and contrarian strategies. Users are advised to apply appropriate risk management and test the indicator on demo accounts before live trading. Additional automated bots based on this indicator are available separately.
指标配置
客户评价
5.0
评价:1
5 | 100 % | |
4 | 0 % | |
3 | 0 % | |
2 | 0 % | |
1 | 0 % |
客户评价
May 25, 2025
This indicator has proven to be a valuable tool. The key is in the setup – once you've dialed in the right settings for your needs, the signals it generates are top-notch and very effective. It definitely requires a bit of attention to configure, but the results are worth it
讨论
常见问答
BTCUSD
Forex
Signal
Breakout
Indices
EURUSD
Commodities
GBPUSD
NZDUSD
RSI
Martingale
Prop
Crypto
Grid
Stocks
XAUUSD
NAS100
USDJPY
cTrader Store 提供的所有产品,包括交易机器人、指标和插件,均由第三方开发者提供,仅供信息参考和技术访问之用。cTrader Store 并非经纪商,不提供投资建议、个人推荐或任何未来业绩保证。


价格
42.11M
交易量
6.13M
盈利点数
221
销售
8.37K
免费安装