
Free_ICT Breakers_BOS_MSS_withSourceCode
指标
599 下载
版本 1.0, Nov 2025
Windows 版、Mac 版
5.0
评价:2
说明
🚀 ICT突破者(BOS/MSS)- 掌握市场结构转变
通过ICT突破者解锁专业交易见解,这是一款识别关键市场结构变化的终极工具。基于机构综合交易者(ICT)方法论,该指标自动检测专业交易者用来识别趋势延续和反转的结构突破(BOS)和市场结构转变(MSS)模式。
🔥 主要特点
🎯 智能信号检测
- 结构突破(BOS):识别趋势延续信号
- 市场结构转变(MSS):发现潜在的趋势反转点
- 多时间框架分析:在较低时间框架图表上显示较高时间框架结构
- 可定制灵敏度:调整摆动条参数以实现最佳检测
🎨 专业可视化
- 颜色编码信号:多种颜色区分看涨/看跌的BOS和MSS
- 可定制样式:可选择实线、点线或虚线
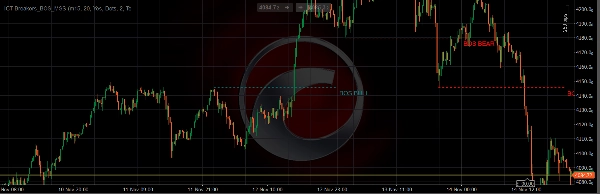
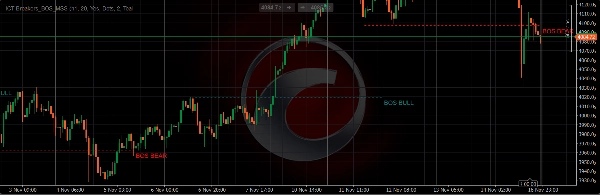
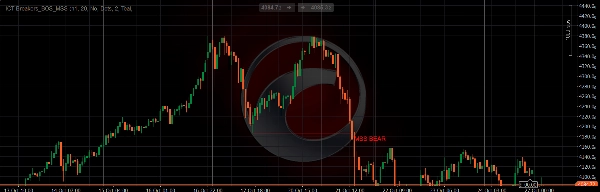
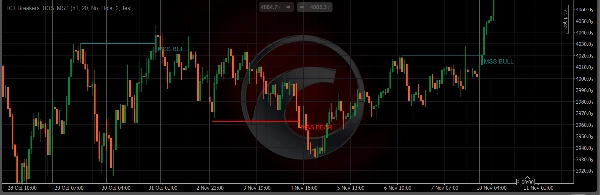
- 清晰标签:每个信号标记为“BOS BULL”、“BOS BEAR”、“MSS BULL”或“MSS BEAR”
- 多种显示选项:可独立显示/隐藏BOS或MSS
⚡ 高级配置
- 实体/影线检测:可选择仅实体或实体+影线突破标准
- 可调时间框架:分析任意较高时间框架的结构
- 灵活的摆动设置:自定义枢轴点灵敏度
- 视觉定制:完全控制颜色、线条样式和宽度
🔔 智能警报系统
- 视觉警报:图表上的文本通知
- 音频警报:可选声音通知
- 无重绘:信号一旦形成保持一致
- 自定义警报名称:个性化警报消息
📈 工作原理
ICT突破者分析价格行为以识别市场结构何时被突破:
- BOS(结构突破):当价格沿趋势方向突破之前的结构时发生,表示趋势延续
- MSS(市场结构转变):当价格逆趋势突破结构时发生,预示潜在反转
该指标利用多时间框架的复杂枢轴点检测,提供准确及时的信号,帮助您:
- 及早捕捉趋势延续
- 在反转发生前发现潜在反转
- 以机构级市场结构意识进行交易
- 通过多时间框架确认减少错误信号
🎯 适合人群
- 寻求机构概念的价格行为交易者
- ICT方法论追随者
- 寻找清晰结构突破信号的交易者
- 多时间框架分析爱好者
- 希望实现自动化市场结构监控的人士
⚙️ 轻松设置
- 将指标添加到图表
- 设置您偏好的较高时间框架进行结构分析
- 自定义颜色和样式以匹配您的交易风格
- 启用警报以获得实时通知
- 开始使用专业的市场结构见解进行交易
💡 交易应用
- 趋势跟随:使用BOS信号进入顺势仓位
- 反转交易:MSS信号提醒潜在趋势变化
- 突破确认:通过结构分析验证突破交易
- 市场背景:一目了然地了解整体市场结构
免费至2025年12月31日,尽情享受!!!
摘要
AI 摘要
ICT Breakers (BOS/MSS) is a professional indicator designed to detect key market structure changes based on Institutional Composite Trader (ICT) methodologies. It automatically identifies Break of Structure (BOS) signals, indicating trend continuation, and Market Structure Shift (MSS) signals, highlighting potential trend reversals. The tool supports multi-timeframe analysis, allowing users to view higher timeframe structures on lower timeframe charts for enhanced market context.
Key features include customizable sensitivity settings for swing bar parameters, color-coded bullish and bearish signals, and multiple display options to show or hide BOS and MSS independently. Users can adjust detection criteria between body-only or body-plus-wick breaks and customize visual elements such as colors, line styles, and widths.
The indicator provides smart alerts with on-chart text and optional audio notifications, ensuring signals remain consistent without repainting. It is suitable for price action traders, ICT methodology followers, and those seeking automated market structure monitoring with institutional-level insights.
Setup involves adding the indicator to a chart, selecting a higher timeframe for analysis, customizing visual styles, and enabling alerts. Trading applications include trend following, reversal trading, breakout confirmation, and gaining overall market structure awareness.
指标配置
客户评价
5.0
评价:2
5 | 100 % | |
4 | 0 % | |
3 | 0 % | |
2 | 0 % | |
1 | 0 % |
客户评价
December 18, 2025
For a free tool that packs the core ICT concepts into one script, it's incredibly valuable. Having the source code is a massive bonus for learning and tweaking, though it's definitely aimed at those already deep into the ICT methodology
November 24, 2025
Free_ICT Breakers BOS/MSS automatically flags key structure breaks and shifts per ICT methodology. Great for trend-followers and reversal-seekers alike. Works across timeframes; clean visuals and multi-TF boost context. Would benefit from added alerts and performance logs, but core engine is solid. A must for structure-based traders.
讨论
常见问答
Signal
Breakout
SMC
cTrader Store 提供的所有产品,包括交易机器人、指标和插件,均由第三方开发者提供,仅供信息参考和技术访问之用。cTrader Store 并非经纪商,不提供投资建议、个人推荐或任何未来业绩保证。
该作者的其他作品


价格
10M
交易量
10.64K
盈利点数
22
销售
1.21K
免费安装