
Session HighLow Pivot Points Indicator advanced version
指标
555 下载
版本 1.0, Nov 2025
Windows 版、Mac 版
5.0
评价:1
说明
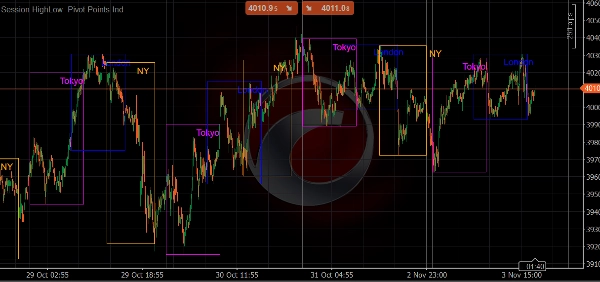
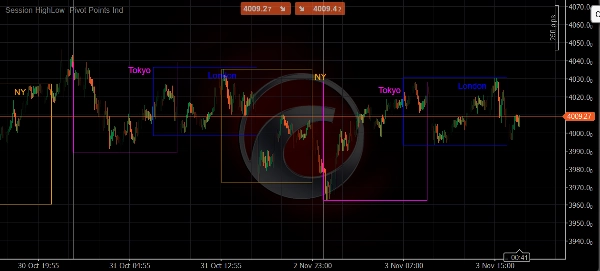
交易时段指示器
使用这个专业的时段指示器增强您的市场分析,直观显示四大主要交易时段:
🕒 主要特点:
- 四大主要时段:纽约、伦敦、东京和悉尼
- 可自定义时间:调整每个时段的开始/结束时间
- 颜色编码框:每个时段都有不同颜色,便于识别
- 历史数据:时段框在所有历史图表数据中持续显示
- 清晰视觉效果:无杂乱,只有清晰的时段范围可视化
🎯 适用对象:
- 识别时段重叠和高波动期
- 理解跨时区的市场结构
- 围绕时段开闭规划交易
- 结合时段背景进行多时间框架分析
⚙️ 可自定义设置:
- 启用/禁用单个时段
- 调整时段时间以匹配您的经纪商
- 更改颜色以匹配您的图表主题
- 切换时段标签和框透明度
默认时段时间:
- 东京:00:00 - 09:00 UTC
- 伦敦:07:00 - 16:00 UTC
- 纽约:13:00 - 22:00 UTC
- 悉尼:21:00 - 06:00 UTC
非常适合外汇交易员、市场分析师以及任何需要在图表上清晰显示时段的用户。
摘要
AI 摘要
The Session HighLow Pivot Points Indicator advanced version visually displays the four major global trading sessions—New York, London, Tokyo, and Sydney—on trading charts. It uses color-coded range boxes to clearly mark each session's timeframe, which persist across historical data for comprehensive analysis. Users can customize session start and end times to align with their broker’s schedule, enable or disable individual sessions, adjust colors to match chart themes, and toggle labels and box transparency. Default session times are set in UTC: Tokyo (00:00–09:00), London (07:00–16:00), New York (13:00–22:00), and Sydney (21:00–06:00). This indicator aids in identifying session overlaps, high volatility periods, and understanding market structure across time zones. It supports multi-timeframe analysis and is suitable for forex, indices, commodities, crypto, and stocks markets, including symbols like BTCUSD, EURUSD, GBPUSD, XAUUSD, NAS100, and USDJPY. The tool is designed for traders and analysts who require clear visualization of trading sessions to plan trades around session openings and closings.
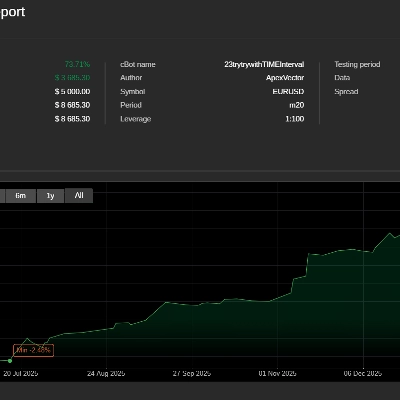
指标配置
客户评价
5.0
评价:1
5 | 100 % | |
4 | 0 % | |
3 | 0 % | |
2 | 0 % | |
1 | 0 % |
客户评价
December 18, 2025
Before this indicator, my session-based strategy was all manual guesswork. Now, I get a clean, automated structural read of the Asian, London, and NY ranges at a glance. It doesn’t trade for you, but it perfectly frames the battlefield—making confluences with order flow or price action far more actionable. A professional-grade tool that's become essential to my pre-market analysis.
讨论
常见问答
BTCUSD
Forex
Signal
Indices
EURUSD
Commodities
GBPUSD
NZDUSD
Prop
Crypto
Stocks
XAUUSD
NAS100
USDJPY
cTrader Store 提供的所有产品,包括交易机器人、指标和插件,均由第三方开发者提供,仅供信息参考和技术访问之用。cTrader Store 并非经纪商,不提供投资建议、个人推荐或任何未来业绩保证。
该作者的其他作品

猜您喜欢


价格
10M
交易量
10.64K
盈利点数
23
销售
1.23K
免费安装