说明
📌 指标的功能
MarketStructureOscSignals 是一个 纯价格行为信号工具。
它:
- 使用左右回顾检测 摆动高点和摆动低点。
- 跟踪这些摆动是否形成:
-
- 更高的高点 + 更高的低点 → 看涨结构
- 更低的高点 + 更低的低点 → 看跌结构
- 当结构 切换时:
-
- 从看跌 → 看涨 → 它绘制一个 买入信号
- 从看涨 → 看跌 → 它绘制一个 卖出信号
所以每个信号代表一个 市场结构的真实变化,而不仅仅是均线交叉。
⚙️ 输入参数及设置方法
1. Swing Left / Swing Right
这些控制摆动高/低点的“严格程度”。
- Swing Left(默认值 2)
摆动点左侧必须有更低的高点(对于摆动高点)或更高的低点(对于摆动低点)的柱数。 - Swing Right(默认值 2)
右侧必须有相同条件确认摆动的柱数。
使用方法:
- 较小的值(1–2):
-
- 更多摆动,更多信号
- 适用于 较高时间框架(H1,H4,D1)
- 较大的值(3–4+):
-
- 仅重大结构转折
- 信号较少但更强
- 适用于 较低时间框架以避免噪音
2. Min Bars Between Signals
两个信号之间必须经过的最小柱数。
- 避免 箭头聚集在每次微小回调时出现。
- 示例:
-
- 设置为
3→ 信号之间至少间隔 3 根柱子。 - 在非常快的图表(M1–M5)上,您可能需要
5–10。 - 在 H1 或更高时间框架上,通常
2–3就足够了。
- 设置为
3. Arrow Offset (pips)
箭头和标签距离蜡烛的距离(以点数计)。
- 对于外汇:
-
5–10点通常看起来不错。
- 对于指数(US500,US100 等):
-
- 使用更大的偏移(例如 20–50 “点”,取决于经纪商的点值)。
如果箭头与蜡烛重叠,请增加此值。
如果它们太远,请减少。
4. 显示买入/卖出文本
true→ 显示箭头(↑/↓)和“BUY”或“SELL”文本。false→ 仅显示箭头。
如果图表显得杂乱,可以隐藏文本,仅保留箭头。
🔍 信号生成逻辑
指标内部:
- 跟踪 最近两个摆动高点 和 最近两个摆动低点:
-
_prevHigh,_lastHigh_prevLow,_lastLow
- 基于这些检查:
-
- 高点和低点是否 同时上升?
-
- → 看涨趋势(
StructureTrendSignal.Bullish)
- → 看涨趋势(
- 高点和低点是否 同时下降?
-
- → 看跌趋势(
StructureTrendSignal.Bearish)
- → 看跌趋势(
- 如果不一致,则保持之前的趋势。
- 每当结构趋势变化时:
-
看跌 → 看涨→ 买入信号看涨 → 看跌→ 卖出信号
- 它还确保:
-
- 趋势不是
未知(即不是刚开始)。 - 自上一个信号以来已经经过足够的柱数(
MinBarsBetweenSignals)。
- 趋势不是
这意味着每个箭头标记一个 真实的结构转变,而非随机噪音。
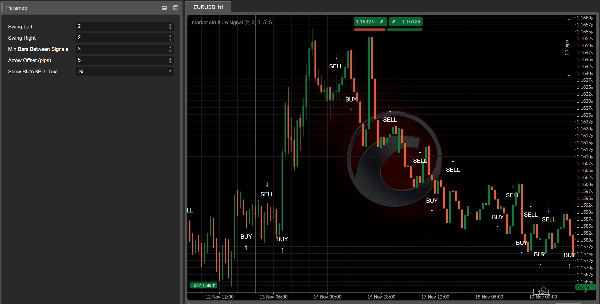
📈 如何读取图表上的买入/卖出信号
✅ 买入信号
你看到的是:
- 蜡烛下方的 向上箭头
↑ - 可选的箭头旁边的 “BUY”文本
它的含义是:
- 结构从 看跌 → 看涨 发生了变化。
- 最近的摆动高点和低点现在 都在上升。
- 市场可能正在转入新的上升趋势或恢复看涨结构。
使用方法:
- 寻找多头入场点:
-
- 在信号蜡烛或接下来的几根蜡烛上。
- 最好是在小幅回调到支撑位后(之前的摆动低点、需求区、VWAP、VA低点等)。
- 使用 Kalman 趋势 / EMA / 成交量剖面等工具进行过滤:
-
- 仅当更高时间框架或 Kalman 也呈看涨时才买入。
✅ 卖出信号
你看到的是:
- 蜡烛上方的 向下箭头
↓ - 可选的 “SELL” 文本
它的含义是:
- 结构从 看涨 → 看跌 发生了变化。
- 摆动高点和低点现在 都在下降。
- 市场可能正在进入下跌趋势或恢复看跌结构。
使用方法:
- 寻找空头入场点:
-
- 在信号蜡烛或随后的蜡烛上靠近阻力位。
- 理想情况下是在破损支撑(现阻力)、VAH、供应区等的回测后。
🎯 实用交易用途
1. 作为独立入场工具
简单规则集:
- 买入设置
-
- 等待 买入箭头。
- 在信号蜡烛附近下多单。
- 止损设在最近摆动低点下方。
- 目标设在之前的摆动高点或关键阻力位。
- 卖出设置
-
- 等待 卖出箭头。
- 在信号蜡烛附近下空单。
- 止损设在最近摆动高点上方。
- 目标设在之前的摆动低点或关键支撑位。
这是最基本的用法,最适合 H1、H4 和 D1,结构更清晰。
2. 作为其他指标的确认工具
这时它的威力体现出来了。
🔹 配合 Kalman 滤波趋势
- 仅在以下情况下接受 买入信号:
-
- Kalman 趋势向上倾斜,且价格位于或高于 Kalman 线。
- 仅在以下情况下接受 卖出信号:
-
- Kalman 趋势向下倾斜,且价格位于或低于 Kalman 线。
效果:
Kalman 给你一个 平滑趋势,MarketStructureOscSignals 给你 精准的结构转变。两者结合过滤了许多错误交易。
🔹 配合 成交量剖面 / 支撑与阻力
- 强买入信号:
-
- 买入箭头出现在 接近 VA 低点、之前的摆动低点或流动性清扫,伴随拒绝信号。
- 强卖出信号:
-
- 卖出箭头出现在 接近 VA 高点、之前的摆动高点或流动性清扫顶部。
这里的信号不仅是技术形态,还锚定在 流动性和订单流区域。
3. 用于加仓/减仓
你也可以将新信号用作:
- 加仓点
当新信号与现有交易方向一致且更高时间框架对齐时,增加仓位。 - 提前退出 / 部分退出
如果你持多仓且出现 卖出信号(尤其是在关键结构附近),你可以: -
- 部分平仓
- 或收紧止损
🧪 推荐的初始设置
对于 外汇 H1 / H4:
Swing Left = 2Swing Right = 2Min Bars Between Signals = 3Arrow Offset = 5–10 pips
对于 指数 M15 / H1:
Swing Left = 2–3Swing Right = 2–3Min Bars Between Signals = 5Arrow Offset根据品种调整(例如 20–50 “点”,取决于经纪商)
对于 加密货币 H1 / H4:
- 稍微提高摆动值以过滤噪音:
-
Swing Left = 3Swing Right = 3Min Bars Between Signals = 4–6
始终使用你偏好的品种和时间框架进行回测,以微调 Swing 和 MinBarsBetweenSignals。
摘要
客户评价
5 | 100 % | |
4 | 0 % | |
3 | 0 % | |
2 | 0 % | |
1 | 0 % |


!["[Stellar Strategies] Market Session Ultimate" 标识](https://cdn.ctrader.com/image/webp/61ffd537-0125-4246-9e72-42eca1791d64_28232)


