
Multi-Asset Performance Matrix
指标
244 下载
版本 1.0, Jun 2025
Windows 版、Mac 版
5.0
评价:1
说明
Pinescriptlabs 商店指标: 🤖Pinescriptlabs 商店 cBots : (cBot) Gold & BTC 突破会话枢轴(新)
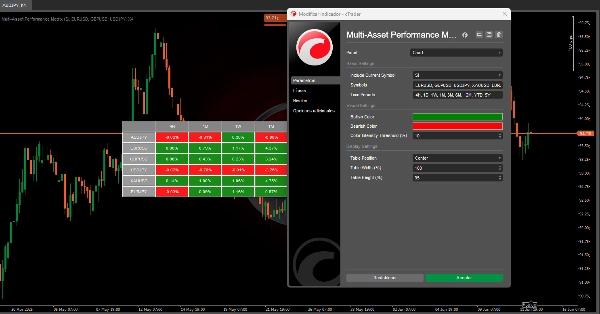
🚀 多资产表现矩阵 🚀
该算法是一个 强大的可视化工具 📊,旨在显示不同时间段内多个金融工具的 百分比表现。
它将 历史数据 转化为一个 高效且直观的可视化,使用户能够快速评估各种金融资产的行为。
❓ 这个工具的作用是什么?
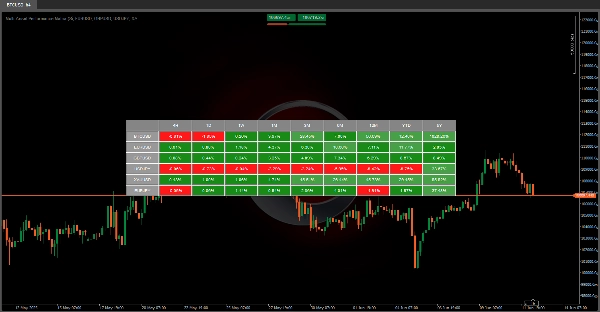
1️⃣ 📈 资产比较:显示不同金融工具(如 BTCUSD、EURUSD、XAUUSD等)的价格随时间的变化情况。
- 时间框架: 日线 (D) | 周线 (1W) | 月线 (1M) | 季度 (3M) | 半年 (6M) | 年度 (12M) | 年初至今 (YTD) | 5年 (5Y)
2️⃣ 🎨 突出趋势:使用 颜色编码 (🟢, 🔴 ) 立即识别每个时期内资产的上涨或下跌。
3️⃣ ⏱️ 自动更新:每分钟刷新数据 以反映最新市场信息。
💡 为什么这很有用?
✔ 📊 比较分析:支持多个资产的并排比较——非常适合 投资组合管理 或基于时间范围选择表现最佳的资产。
✔ 🛡️ 控制:评估资产在不同周期内的 一致性(或波动性)有助于评估 相关风险。
✨ 关键点
✅ ⏳ 节省时间:手动收集和计算这些数据需要 数小时——该工具瞬间完成!
✅ 👀 视觉清晰:该 颜色编码系统 使分析变得简单,即使是 非技术用户也能轻松理解。
✅ 🔄 适应性强:支持 自定义符号,让您可以跟踪重要资产。
摘要
AI 摘要
The Multi-Asset Performance Matrix is a visual indicator designed to display the percentage performance of multiple financial instruments across various timeframes. It compares assets such as BTCUSD, EURUSD, and XAUUSD over daily, weekly, monthly, quarterly, semi-annual, annual, year-to-date, and five-year periods. The tool uses color-coding (green and red) to highlight rising or falling trends, enabling quick visual assessment of asset behavior. It automatically updates every minute to provide the latest market data. This matrix facilitates side-by-side comparative analysis, aiding portfolio management and asset selection based on performance consistency and volatility across timeframes. It supports custom symbols, allowing users to track assets relevant to their interests. The tool transforms historical data into an efficient, intuitive visualization, saving time by automating data collection and calculation, and making analysis accessible even to non-technical users.
指标配置
客户评价
5.0
评价:1
5 | 100 % | |
4 | 0 % | |
3 | 0 % | |
2 | 0 % | |
1 | 0 % |
客户评价
June 18, 2025
I see there is problem or error when adding 1H timeframe Great work! thanks a lot.
讨论
常见问答
BTCUSD
Breakout
EURUSD
Supertrend
Commodities
RSI
Crypto
XAUUSD
ATR
cTrader Store 提供的所有产品,包括交易机器人、指标和插件,均由第三方开发者提供,仅供信息参考和技术访问之用。cTrader Store 并非经纪商,不提供投资建议、个人推荐或任何未来业绩保证。


猜您喜欢

!["[Stellar Strategies] Smart ADX" 标识](https://cdn.ctrader.com/image/webp/af13b084-b6f6-41db-b7bc-c7e688b57b05_36929)


!["[Stellar Strategies] MARSI Signal Plotter" 标识](https://cdn.ctrader.com/image/webp/7b2b8da6-8f8e-4646-8d4a-4710c516c01e_25567)


价格
注册日期 03/10/2024
163
销售
38.67K
免费安装