
Channel Price Predictor
指标
427 下载
版本 1.0, Apr 2025
Windows 版、Mac 版
5.0
评价:1
说明
Pinescritlabs
Ctrader Store 指标: 🤖Pinescritlabs Ctrader Store cBots:
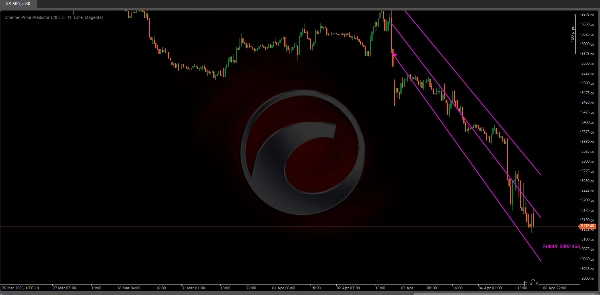
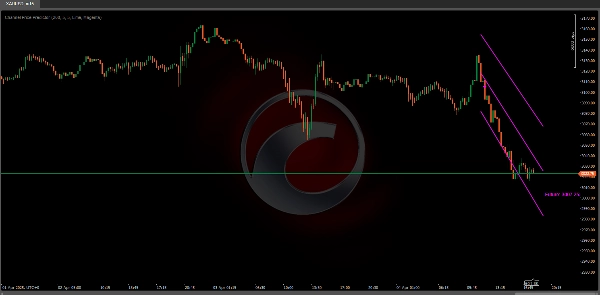
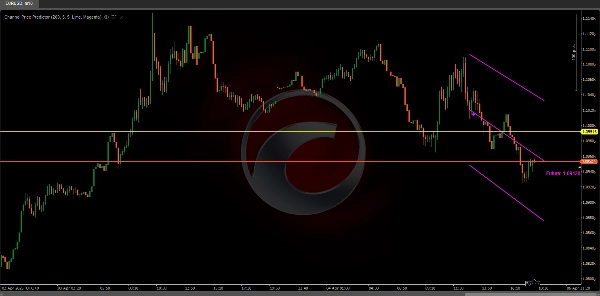
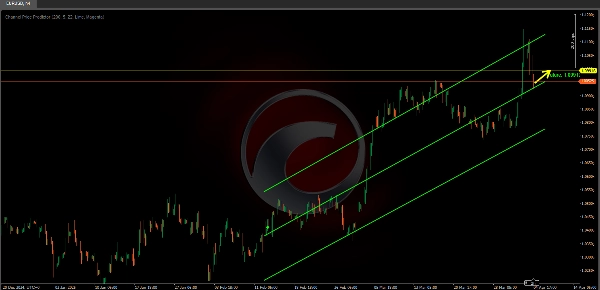
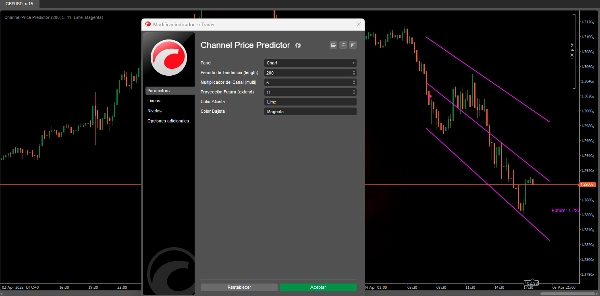
通道价格预测器 识别并绘制趋势通道(无论是 看涨 还是 看跌)在图表上,延伸至未来以预测可能的价格区域。📈🔮
该通道基于 ATR(平均真实波幅),用于衡量市场波动性。近期波动性越高,通道越宽,有助于可视化可能的波动范围。📊💥
它会自动识别并绘制基于枢轴高点和低点的通道。
可以选择延伸通道线并预测其未来价格。🕒📉
该通道不仅显示当前走势,还通过标签(“未来:…”)给出未来可能的价格估计。📅💡
它的用途是什么?
趋势识别:
该指标使用内部逻辑检测市场何时从 看涨 转变为 看跌(或反之)。这样,您可以更清晰地看到资产处于 上升 或 下降 阶段。📈🔄📉
波动性通道:
该通道基于 ATR(平均真实波幅),用于衡量波动性。近期波动性越高,通道越宽。这帮助您看到 可能波动范围。📊🔍
未来预测:
该指标不仅显示当前趋势,还将通道延伸至未来几个周期(可配置),以便您预测该趋势内可能的 支撑/阻力区域。⏳🚀
它允许您延伸通道线并预测其未来价格。⬆️⬇️
价格参考:
通过绘制中线及上下边缘,它为您提供放置止损、目标,甚至管理 进出场 的参考,提供更多关于波动性的信息。🎯📍
由于 cTrader 的限制,目前无法在图表上向右滚动以正确查看通道的未来延伸部分。
建议将 “未来预测” 参数设置为小于 25 个周期,以避免显示问题。
一旦 cTrader 实现了将图表延伸到未来的功能,我们将改进算法以充分利用此功能。
摘要
AI 摘要
The Channel Price Predictor is a technical indicator for cTrader that identifies and draws bullish or bearish trend channels on price charts. It uses pivot highs and lows combined with the Average True Range (ATR) to measure market volatility and dynamically adjust the channel width. Higher recent volatility results in a wider channel, illustrating the probable range of price movements.
Key features include automatic detection of trend direction changes, visualization of current trend channels, and the ability to extend channel lines into the future. This future projection helps anticipate potential support and resistance zones by displaying estimated price values labeled as “Future: …”. The indicator draws a central line along with upper and lower channel boundaries, providing reference points for placing stops, targets, and managing trade entries and exits with volatility context.
Users can configure the number of periods for future projection, with a recommended maximum of 25 periods to avoid display issues due to cTrader platform limitations. The indicator supports analysis of various markets including cryptocurrencies (e.g., BTCUSD), commodities (e.g., XAUUSD), and others where volatility and trend identification are relevant.
指标配置
客户评价
5.0
评价:1
5 | 100 % | |
4 | 0 % | |
3 | 0 % | |
2 | 0 % | |
1 | 0 % |
客户评价
August 18, 2025
Accurate dynamic price channels, customizable, low system load. Cons: No alerts, no MTF mode, no auto-trading integration.
讨论
常见问答
BTCUSD
Breakout
Supertrend
Commodities
RSI
Crypto
XAUUSD
ATR
cTrader Store 提供的所有产品,包括交易机器人、指标和插件,均由第三方开发者提供,仅供信息参考和技术访问之用。cTrader Store 并非经纪商,不提供投资建议、个人推荐或任何未来业绩保证。


猜您喜欢


价格
注册日期 03/10/2024
163
销售
39.08K
免费安装