说明
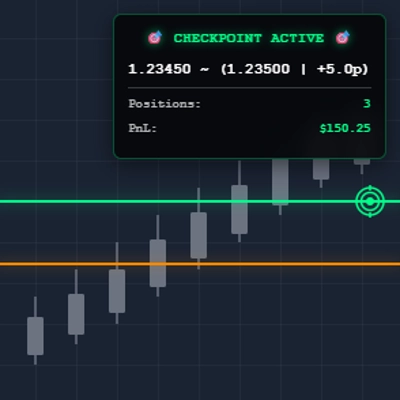
检查点指标
用于多头寸管理的智能平均价格计算器。实时显示盈亏平衡点,并提供动态视觉反馈。非常适合管理任何工具多次入场的交易者。
主要功能:
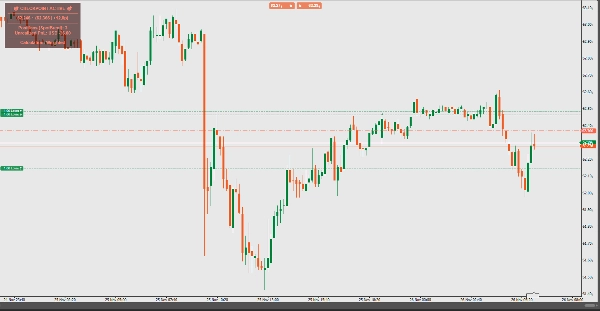
- 实时加权平均计算
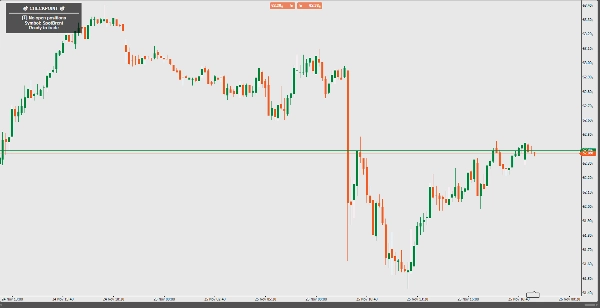
- 智能线条显示(仅在持有2个及以上头寸时显示)
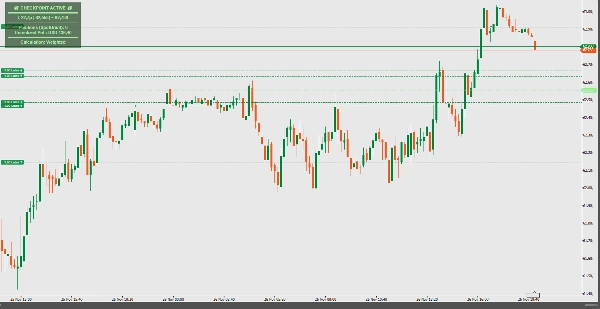
- 基于盈亏的动态着色(绿色/红色/白色)
- 以点数显示当前价格的强度指标
- 简洁专业的信息面板
- 零延迟性能
工作原理:
自动使用加权成交量或简单平均方法计算您的持仓平均价格。当您持有多个头寸时,指标会显示一条清晰的水平线标记您的盈亏平衡点,帮助您根据整体持仓状况做出明智的交易决策。
适用人群:
- 逐步加仓/减仓的持仓交易者
- 跨工具的投资组合管理
- 风险管理和止损设置
- 可视化您的交易账户平衡点
只需应用于任何图表,让检查点指标为您处理剩下的事情——让您的交易检查点变得简单!
摘要
指标配置
客户评价
0.0
评价:0
客户评价
该产品尚无评价。已经试过了?抢先告诉其他人!
讨论
常见问答
BTCUSD
Forex
Indices
EURUSD
Commodities
GBPUSD
NZDUSD
Crypto
Stocks
XAUUSD
NAS100
USDJPY
cTrader Store 提供的所有产品,包括交易机器人、指标和插件,均由第三方开发者提供,仅供信息参考和技术访问之用。cTrader Store 并非经纪商,不提供投资建议、个人推荐或任何未来业绩保证。
该作者的其他作品


价格
注册日期 28/12/2024
54
免费安装