
Levels
指标
175 下载
版本 1.0, Jan 2026
Windows 版、Mac 版

说明
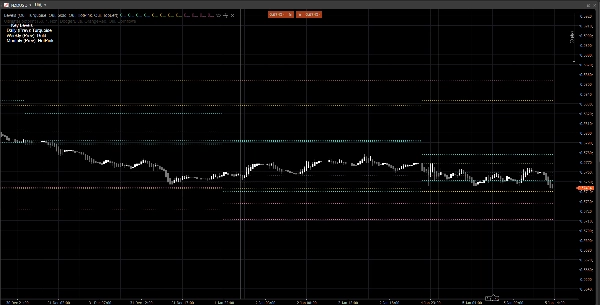
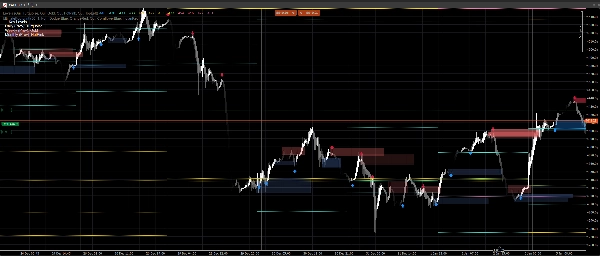
价格行为区间 是一个轻量级、无噪音的指标,直接在您的图表上绘制之前的日线、周线和月线关键水平。
它显示:
- 前一日:最高 / 最低 / 开盘 / 收盘
- 前一周:最高 / 最低 / 开盘 / 收盘
- 前一月:最高 / 最低 / 开盘 / 收盘
这些水平被广泛用作 反应区间、流动性参考 和 上下文锚点,用于市场结构、入场、目标和风险布置。
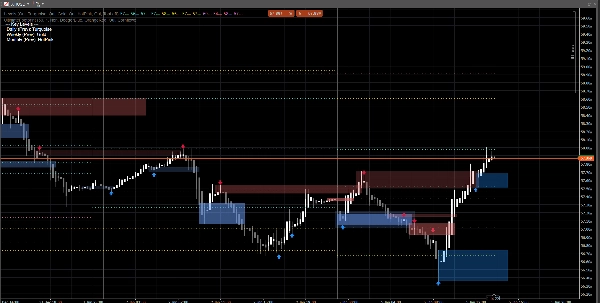
它的用途
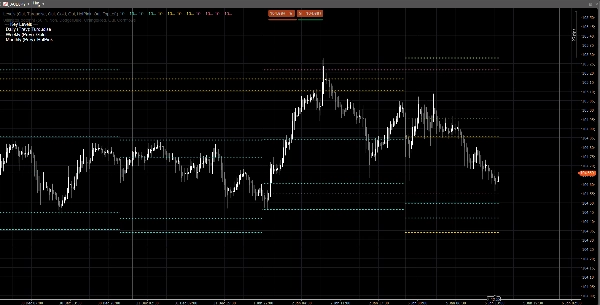
- 无需切换图表即可即时查看更高时间框架的参考水平
- 帮助您围绕前一日高/低、前一周高/低、前一月高/低构建日内价格行为
- 清晰的视觉效果:水平在当前会话/周/月内保持不变
- 适用于任何符号和时间框架
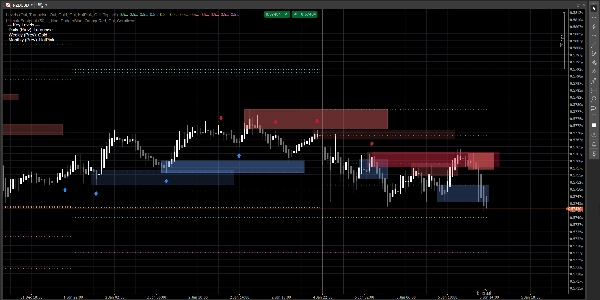
自定义
您可以独立切换每个时间框架:
- 显示日线 / 周线 / 月线
- 为每组设置自定义颜色
- 启用简单的图例,并可选择角落位置
技术说明
- 水平是使用之前完成的日线/周线/月线蜡烛计算的(不是当前形成的蜡烛)。
- 这防止了重绘,并保持水平在会话期间稳定。
免责声明
此指标仅用于图表和决策支持。它不生成买卖信号,也不是财务建议。请始终管理风险并自行验证数据。
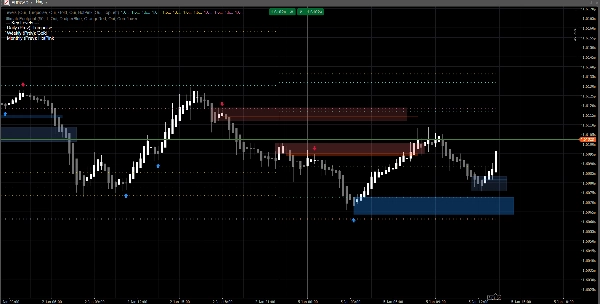
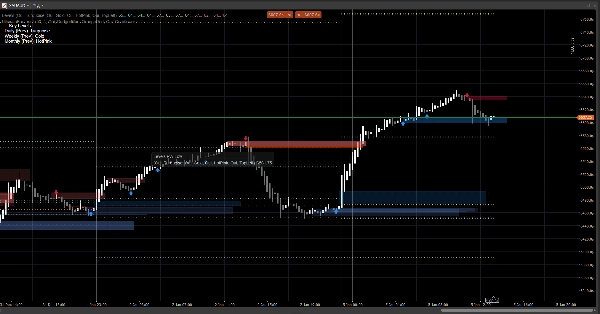
图表上的信号由我个人资料中提供的指标 Ultimate Footprint 生成。
摘要
指标配置
客户评价
0.0
评价:0
客户评价
该产品尚无评价。已经试过了?抢先告诉其他人!
讨论
常见问答
Prop
Forex
Indices
Commodities
Crypto
Stocks
cTrader Store 提供的所有产品,包括交易机器人、指标和插件,均由第三方开发者提供,仅供信息参考和技术访问之用。cTrader Store 并非经纪商,不提供投资建议、个人推荐或任何未来业绩保证。
猜您喜欢


!["[Stellar Strategies] Inside Bar with Signals" 标识](https://cdn.ctrader.com/image/webp/1d9e8bfa-3b2c-4440-bb37-5856902008a7_30683)
价格
注册日期 23/07/2025
6.91M
交易量
27.63K
盈利点数
877
免费安装