Phân Tích FVG Chính Xác - Chỉ Báo Fair Value Gap Chuyên Nghiệp
Tổng Quan
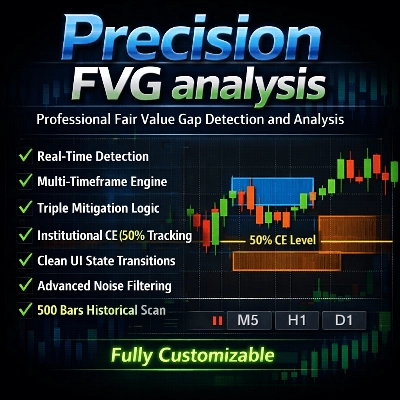
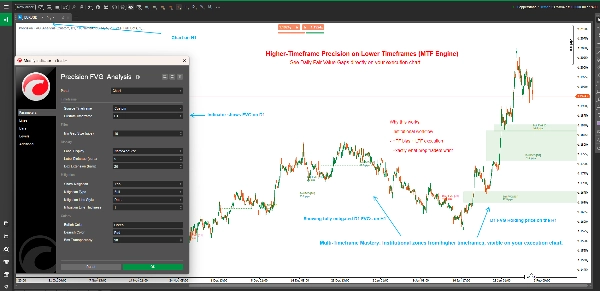
Phân Tích FVG Chính Xác là một chỉ báo phát hiện Fair Value Gap (FVG) mạnh mẽ và linh hoạt, được thiết kế cho các nhà giao dịch nghiêm túc sử dụng các Khái Niệm Smart Money (SMC) và phương pháp ICT. Chỉ báo tiên tiến này tự động xác định, theo dõi và trực quan hóa các Fair Value Gap trên nhiều khung thời gian với khả năng theo dõi giảm thiểu tinh vi.
Fair Value Gaps đại diện cho sự mất cân bằng trên thị trường khi giá di chuyển quá nhanh, để lại những điểm không hiệu quả mà thường được quay lại. Hiểu và giao dịch các khoảng trống này rất quan trọng đối với các nhà giao dịch hành động giá hiện đại.
Các Tính Năng Chính
🎯 Phân Tích Đa Khung Thời Gian
- Phát Hiện Khung Thời Gian Thích Ứng: Chọn hiển thị FVG từ khung thời gian biểu đồ hiện tại hoặc bất kỳ khung thời gian tùy chỉnh nào
- Giao Dịch Chéo Khung Thời Gian: Xem FVG khung thời gian cao hơn trên biểu đồ khung thời gian thấp hơn để có bối cảnh giao dịch tốt hơn
- Nhãn Khung Thời Gian Thông Minh: Tự động nhận diện khung thời gian trong nhãn khi sử dụng khung thời gian tùy chỉnh
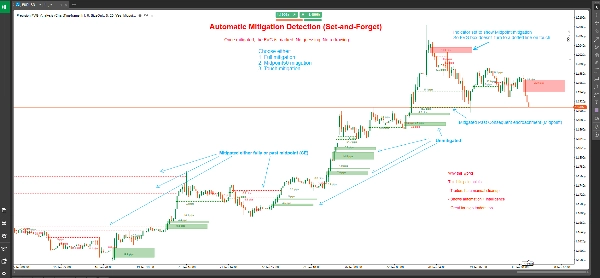
📊 Theo Dõi Giảm Thiểu Nâng Cao
- Ba Loại Giảm Thiểu:
-
- Giảm Thiểu Toàn Phần: Giá hoàn toàn lấp đầy toàn bộ khoảng trống (cách tiếp cận thận trọng nhất)
- Điểm Giữa 50% (CE): Giá đạt đến mức Xâm Nhập Tiếp Theo (cách tiếp cận cân bằng)
- Giảm Thiểu Chạm: Giá chạm vào ranh giới khoảng trống (nhạy cảm nhất)
- Thay Đổi Trạng Thái Trực Quan: FVG chưa giảm thiểu hiển thị dưới dạng hộp đầy; FVG đã giảm thiểu chuyển thành đường chấm
- Đánh Dấu Giảm Thiểu Chính Xác: Hiển thị chính xác cây nến nơi giảm thiểu xảy ra
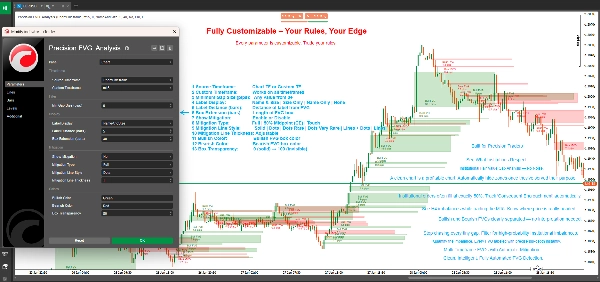
🎨 Hiển Thị Tùy Biến Hoàn Toàn
- Mở Rộng Hộp Linh Hoạt: Kiểm soát khoảng cách hộp FVG mở rộng vào tương lai (0-500 cây nến)
- Hệ Thống Gắn Nhãn Thông Minh: Chọn từ bốn chế độ nhãn:
-
- Tên và Kích Thước: Chi tiết đầy đủ với loại FVG và kích thước pip
- Chỉ Kích Thước: Chỉ kích thước khoảng trống tính bằng pip
- Chỉ Tên: Nhận diện loại FVG
- Không Có: Biểu đồ sạch không có nhãn
- Màu Sắc Tùy Chỉnh: Phân biệt màu sắc tăng và giảm
- Độ Trong Suốt Điều Chỉnh: Độ trong suốt hộp từ 0-100%
- Tùy Chỉnh Đường Giảm Thiểu: Chọn kiểu đường và độ dày cho FVG đã giảm thiểu
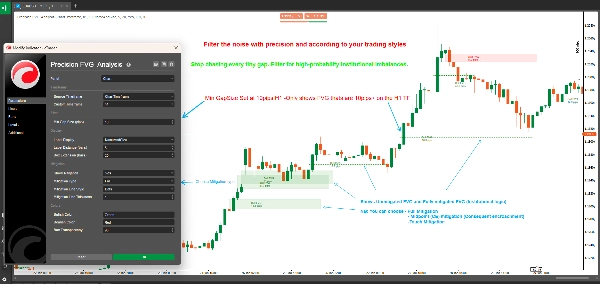
⚙️ Lọc Chuyên Nghiệp
- Bộ Lọc Kích Thước Khoảng Trống Tối Thiểu: Đặt yêu cầu pip tối thiểu để lọc các khoảng trống không đáng kể
- Phát Hiện Tự Động: Xác định FVG theo thời gian thực khi mỗi cây nến đóng mới
- Quét Lịch Sử: Tự động quét lên đến 500 cây nến lịch sử khi khởi tạo
Fair Value Gaps là gì?
Fair Value Gaps (FVGs) xảy ra khi có sự không hiệu quả về giá giữa ba cây nến liên tiếp:
FVG Tăng: Hình thành khi đáy cây nến hiện tại cao hơn đỉnh cây nến cách hai cây trước, với cây nến giữa đóng cửa trên đỉnh đó. Điều này tạo ra khoảng trống hướng lên thường đóng vai trò hỗ trợ.
FVG Giảm: Hình thành khi đỉnh cây nến hiện tại thấp hơn đáy cây nến cách hai cây trước, với cây nến giữa đóng cửa dưới đáy đó. Điều này tạo ra khoảng trống hướng xuống thường đóng vai trò kháng cự.
Những khoảng trống này đại diện cho các khu vực có sự mua hoặc bán mạnh mẽ, để lại sự mất cân bằng giá mà thị trường thường xuyên quay lại để tìm "giá hợp lý" trước khi tiếp tục theo hướng ban đầu.
Hiểu về các loại giảm thiểu
Giảm Thiểu Toàn Phần (Thận Trọng)
- FVG Tăng: Được giảm thiểu khi giá giao dịch dưới đáy của khoảng trống
- FVG Giảm: Được giảm thiểu khi giá giao dịch trên đỉnh của khoảng trống
- Trường Hợp Sử Dụng: Xác nhận rằng khoảng trống đã được lấp đầy hoàn toàn, phù hợp với nhà giao dịch swing và các chiến lược tìm kiếm xác nhận
Điểm Giữa 50% / CE (Cân Bằng)
- FVG Tăng: Được giảm thiểu khi giá đạt hoặc cắt xuống dưới điểm giữa
- FVG Giảm: Được giảm thiểu khi giá đạt hoặc cắt lên trên điểm giữa
- Trường Hợp Sử Dụng: Mức Xâm Nhập Tiếp Theo (CE) thường là nơi các tổ chức đặt lệnh, làm cho đây là điểm lý tưởng để vào lệnh với tỷ lệ rủi ro - lợi nhuận tốt
Giảm Thiểu Chạm (Mạnh Mẽ)
- FVG Tăng: Được giảm thiểu khi giá chạm hoặc cắt qua ranh giới trên cùng
- FVG Giảm: Được giảm thiểu khi giá chạm hoặc cắt qua ranh giới dưới cùng
- Trường Hợp Sử Dụng: Hệ thống cảnh báo sớm cho các nhà giao dịch muốn bắt phản ứng tại ranh giới FVG, lý tưởng cho scalping và vào lệnh nhanh
Cách Sử Dụng
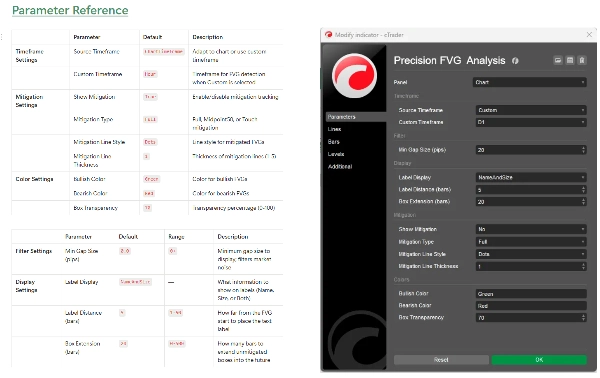
Cài Đặt Cơ Bản
- Thêm Phân Tích FVG Chính Xác vào biểu đồ của bạn
- Đặt Khung Thời Gian Nguồn ưa thích của bạn:
-
- Chọn "ChartTimeframe" để phát hiện FVG trên biểu đồ hiện tại của bạn
- Chọn "Custom" và chọn một khung thời gian cụ thể (ví dụ: H4, D1) để xem FVG khung thời gian cao hơn
- Cấu hình Kích Thước Khoảng Trống Tối Thiểu để lọc các khoảng trống nhỏ, không đáng kể (khuyến nghị: 2-5 pip cho forex)
Cấu Hình Giảm Thiểu
- Bật Hiển Thị Giảm Thiểu để kích hoạt theo dõi giảm thiểu
- Chọn Loại Giảm Thiểu dựa trên phong cách giao dịch của bạn:
-
- Nhà giao dịch trong ngày và scalper: Xem xét "Touch" hoặc "Midpoint50"
- Nhà giao dịch swing: Sử dụng "Full" để xác nhận
- Tùy chỉnh giao diện đường giảm thiểu với Kiểu Đường và Độ Dày
Tùy Biến Trực Quan
- Đặt Mở Rộng Hộp để kiểm soát khoảng cách hộp chiếu ra (mặc định 20 cây nến)
- Chọn sở thích Hiển Thị Nhãn
- Điều chỉnh Màu Tăng và Màu Giảm để phù hợp với chủ đề biểu đồ của bạn
- Tinh chỉnh Độ Trong Suốt Hộp để có độ hiển thị tối ưu
Chiến Lược Giao Dịch
Chiến Lược 1: FVG Khung Thời Gian Cao với Vào Lệnh Khung Thời Gian Thấp
- Đặt chỉ báo ở khung thời gian H4 hoặc D1 trên biểu đồ M15 hoặc M5
- Xác định các FVG khung thời gian cao chưa được giảm thiểu
- Chờ giá tiếp cận FVG trên khung thời gian thấp hơn
- Tìm xác nhận khung thời gian thấp hơn (mẫu nến, khối lệnh, v.v.)
- Vào lệnh khi giá đạt đến mức giảm thiểu bạn chọn
Chiến Lược 2: Vùng Hội Tụ FVG
- Sử dụng nhiều phiên bản của chỉ báo với các khung thời gian khác nhau
- Xác định các khu vực nơi nhiều FVG khung thời gian chồng lên nhau
- Các vùng hội tụ này cung cấp vị trí giao dịch có xác suất cao
- Sử dụng theo dõi giảm thiểu để định thời điểm vào lệnh chính xác
Chiến Lược 3: Xác Nhận Phá Vỡ
- Xác định các mức hỗ trợ/kháng cự chính
- Theo dõi sự hình thành FVG trong các đợt phá vỡ
- FVG chưa giảm thiểu theo hướng phá vỡ cho thấy sự tiếp tục
- FVG đã giảm thiểu cho thấy khả năng phá vỡ thất bại hoặc đảo chiều
Chiến Lược 4: Scalping Dựa Trên Giảm Thiểu
- Sử dụng Giảm Thiểu Chạm trên các khung thời gian thấp hơn (M1, M5)
- Vào lệnh ngay khi FVG bị chạm
- Mục tiêu là đỉnh/đáy swing trước đó
- Sử dụng điểm dừng chặt dưới/trên FVG
Thông Số Kỹ Thuật
- Nền Tảng: cTrader
- Loại: Chỉ Báo Phủ Lên
- Tính Toán: Thời gian thực khi đóng cây nến
- Cây Nến Lịch Sử: Quét lên đến 500 cây nến khi khởi tạo
- Số Lượng FVG Hoạt Động Tối Đa: 500 khoảng trống đồng thời
- Sử Dụng Tài Nguyên: Nhẹ và tối ưu cho hiệu suất
Thực Tiễn Tốt Nhất
Hướng Dẫn Giao Dịch Chung
- Kết Hợp Với Các Khái Niệm Khác: FVG hoạt động tốt nhất khi kết hợp với khối lệnh, bể thanh khoản và cấu trúc thị trường
- Tôn Trọng Bối Cảnh Thị Trường: FVG khung thời gian cao hơn có trọng lượng lớn hơn so với khung thời gian thấp hơn
- Sử Dụng Nhiều Khung Thời Gian: Xếp lớp các FVG khung thời gian khác nhau để tạo hội tụ
- Quản Lý Rủi Ro: Luôn sử dụng điểm dừng lỗ phù hợp; không phải tất cả FVG đều giữ được
Mẹo Tối Ưu
- Điều Chỉnh Kích Thước Khoảng Trống Tối Thiểu: Đặt dựa trên biến động trung bình của công cụ của bạn
- Mở Rộng Hộp: Dài hơn cho giao dịch swing (50-100 cây nến), ngắn hơn cho giao dịch trong ngày (10-20 cây nến)
- Loại Giảm Thiểu: Phù hợp với khung thời gian và phong cách giao dịch của bạn
- Khoảng Cách Nhãn: Điều chỉnh dựa trên độ rối của biểu đồ và mức thu phóng
Những Sai Lầm Thường Gặp Cần Tránh
- Giao Dịch Quá Mức: Không phải mọi FVG đều là cơ hội giao dịch
- Bỏ Qua Bối Cảnh: FVG đi ngược xu hướng mạnh kém tin cậy hơn
- Loại Giảm Thiểu Sai: Scalper dùng giảm thiểu toàn phần bỏ lỡ vào lệnh; nhà giao dịch swing dùng giảm thiểu chạm bị dừng lỗ
- Không Có Xác Nhận: Luôn chờ xác nhận hành động giá tại các mức FVG
Câu Hỏi Thường Gặp
Q: Tại sao một số FVG biến mất ngay lập tức? A: Khi "Hiển Thị Giảm Thiểu" được bật với loại giảm thiểu "Touch", các FVG bị đảo ngược ngay lập tức sẽ nhanh chóng chuyển thành đường chấm. Đây là hành vi bình thường.
Q: Tôi có thể xem nhiều FVG khung thời gian cùng lúc không? A: Có! Thêm chỉ báo nhiều lần vào biểu đồ của bạn với các khung thời gian tùy chỉnh khác nhau để phân tích đa khung thời gian.
Q: Sự khác biệt giữa chỉ báo này và các chỉ báo FVG khác là gì? A: Phân Tích FVG Chính Xác cung cấp khả năng đa khung thời gian, ba loại giảm thiểu và độ rõ nét trực quan vượt trội với hiển thị trạng thái (hộp so với đường).
Q: Tôi nên sử dụng loại giảm thiểu nào? A: Bắt đầu với Midpoint50 (CE) vì nó cân bằng tín hiệu sớm với độ tin cậy. Điều chỉnh dựa trên kết quả và phong cách giao dịch của bạn.
Q: Chỉ báo này có hoạt động trên tất cả các công cụ không? A: Có, chỉ báo hoạt động trên Forex, Chỉ số, Hàng hóa và Tiền điện tử. Điều chỉnh tham số "Kích Thước Khoảng Trống Tối Thiểu" dựa trên biến động của công cụ.
Q: Quét lịch sử kéo dài bao xa? A: Chỉ báo quét lên đến 500 cây nến khi khởi tạo, cung cấp bối cảnh lịch sử toàn diện.
Hỗ Trợ và Cập Nhật
Chỉ báo này được duy trì và cập nhật thường xuyên. Người dùng nhận được:
- Cập nhật thường xuyên với các tính năng mới
- Tối ưu hóa hiệu suất
- Sửa lỗi và cải tiến
- Cập nhật tài liệu
Để đặt câu hỏi, góp ý hoặc hỗ trợ, vui lòng liên hệ qua hệ thống nhắn tin cửa hàng cTrader.
Tuyên Bố Miễn Trách Nhiệm
Giao dịch có rủi ro mất mát đáng kể và không phù hợp với tất cả nhà đầu tư. Hiệu suất trong quá khứ không phản ánh kết quả tương lai. Chỉ báo này là công cụ phân tích và không cấu thành lời khuyên tài chính. Luôn thực hành quản lý rủi ro đúng cách và không bao giờ mạo hiểm nhiều hơn số tiền bạn có thể chịu mất.
Lịch Sử Phiên Bản
Phiên Bản 1.0 (Hiện Tại)
- Phát hiện FVG đa khung thời gian
- Ba loại giảm thiểu (Toàn phần, Midpoint50, Chạm)
- Thay đổi trạng thái trực quan (hộp sang đường chấm)
- Màu sắc và độ trong suốt tùy chỉnh
- Hệ thống gắn nhãn linh hoạt
- Quét lịch sử (500 cây nến)
- Phát hiện và theo dõi thời gian thực
Phân Tích FVG Chính Xác - Nâng tầm giao dịch Fair Value Gap của bạn lên cấp độ chuyên nghiệp.
5 | 100 % | |
4 | 0 % | |
3 | 0 % | |
2 | 0 % | |
1 | 0 % |


![Logo "[Stellar Strategies] MARSI Signal Plotter"](https://cdn.ctrader.com/image/webp/7b2b8da6-8f8e-4646-8d4a-4710c516c01e_25567)


